
Figure 2.
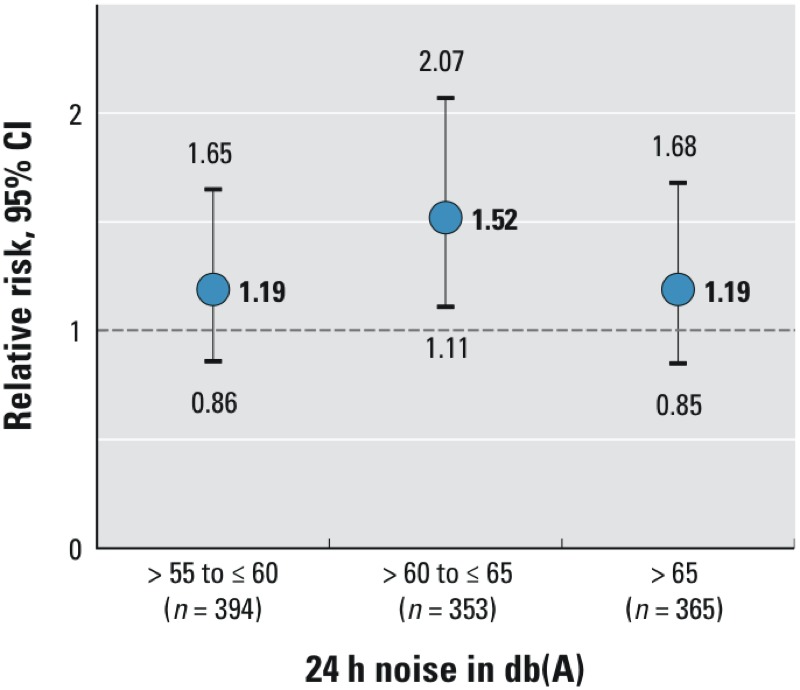
Relative risks and 95% confidence intervals of high depressive symptoms at follow-up in association with exposure to different categories of 24-hr noise compared with the lowest noise category [≤ 55 dB(A); n = 1,986], adjusted for baseline age, sex, education, income, economic activity, neighborhood-level socioeconomic status, and traffic proximity (Model 1). dB(A), A-weighted decibels.