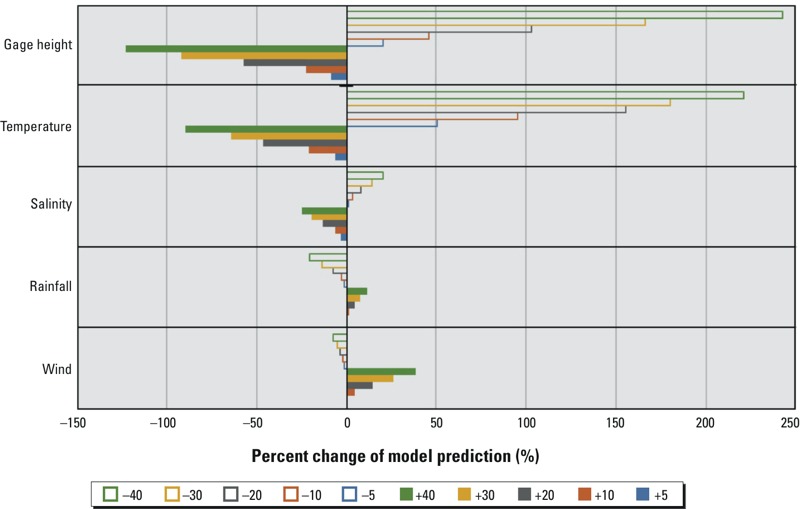
Figure 4.

Sensitivity of the NORF model output to environmental predictors. Solid bars indicate percent changes in the probability (model output) predicted by the NORF model due to positive changes to model input variables; the hollow bars indicate percent changes in the model output due to negative changes to model input variables.
