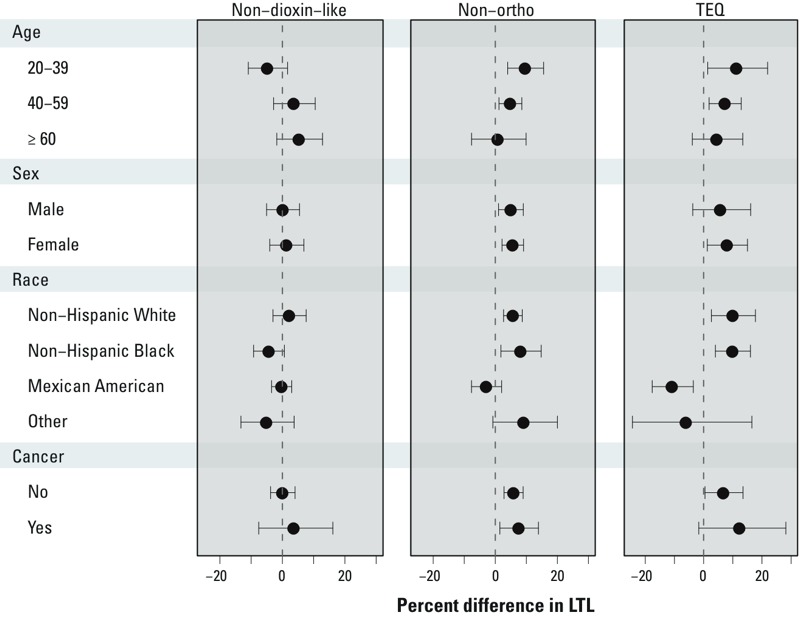
Figure 1.

Association between persistent organic pollutants (POPs) metric exposure and leukocyte telomere length (LTL) in the general U.S. population. Percent difference estimates were generated from stratified models. p-Values were derived from linear regression models with multiplicative interaction terms for age [non–dioxin-like p interaction = 0.14; non-ortho p interaction = 0.80; toxic equivalent (TEQ) p interaction = 0.87]; sex (non–dioxin-like p interaction = 0.18; non-ortho p interaction = 0.23; TEQ p interaction = 0.13); race (non–dioxin-like p interaction = 0.21; non-ortho p interaction = 0.19; TEQ p interaction < 0.01); and cancer status (non–dioxin-like p interaction = 0.72; non-ortho p interaction = 0.68; TEQ p interaction = 0.37). Regression models were adjusted for age, age2, sex, race/ethnicity, body mass index (BMI), log(cotinine), white blood cell count, percent lymphocytes, percent monocytes, percent neutrophils, percent eosinophils, percent basophils. Non–dioxin-like polychorinated biphenyls (PCBs) were adjusted for non-ortho PCBs. Non-ortho PCBs and TEQ were adjusted for non–dioxin-like PCBs. Data points represent percent difference in LTL per each log-unit increase in the exposure metric, and error bars represent 95% confidence intervals.
