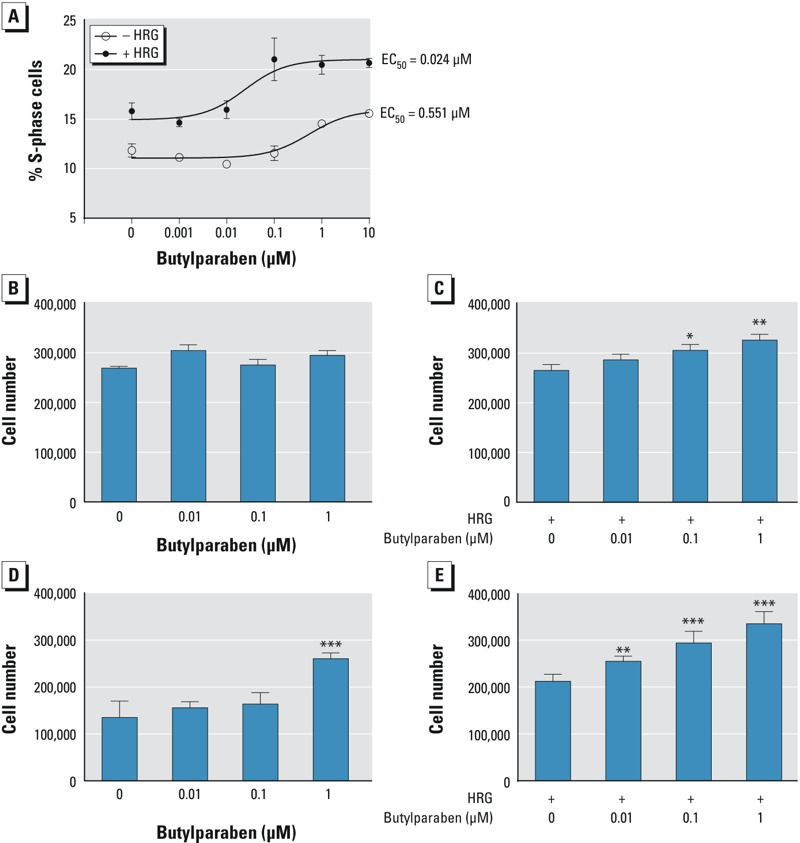
Figure 4.

Effects of heregulin (HRG) on the potency of butylparaben (BP) stimulation of BT-474 cell proliferation. (A) BT-474 cells were treated with the indicated concentrations of BP alone or BP and HRG for 24 hr. Changes in cell cycle distribution were then analyzed by flow cytometry as described in “Materials and Methods.” The percentage of S-phase cells was plotted for different BP concentrations in the absence and presence of HRG. The plotted values are the means (± SD) of biological triplicates, which represent three independent experiments with similar results. (B,C) BT-474 cells were plated in 6-well dishes at 250,000 cells/well. The culture medium was then switched to serum-free medium 24 hr later, and the cells were treated with the indicated concentrations of BP in the absence (B) or presence (C) of HRG (20 ng/mL). The cells were harvested after 24 hr of treatment and then counted with a Coulter counter. The figures are representative of three experiments with similar results. The data are expressed as the means (± SD) obtained from biological triplicates. Statistical significance was analyzed by one-way analysis of variance (ANOVA) followed by a post hoc Tukey’s multiple comparison test to compare the differences between the control and each dose. (C) *p < 0.05 and **p < 0.01 compared with HRG alone. (D,E) BT-474 cells were plated in 6-well dishes at 50,000 cells/well and treated with indicated amounts of BP in the absence (D) or presence (E) of HRG. The cells were harvested after 5 days of treatment and then counted with a Coulter counter. The data are expressed as means (± SD) obtained from biological triplicates and are representative of three experiments with similar results. The statistical significance was analyzed with one-way ANOVA followed by a post hoc Tukey’s multiple comparison test to compare the differences between the control and each dose of BP with or without HRG. (D) ***p < 0.001 compared with the untreated control. (E) **p < 0.01 and ***p < 0.001 compared with cells treated with HRG alone.
