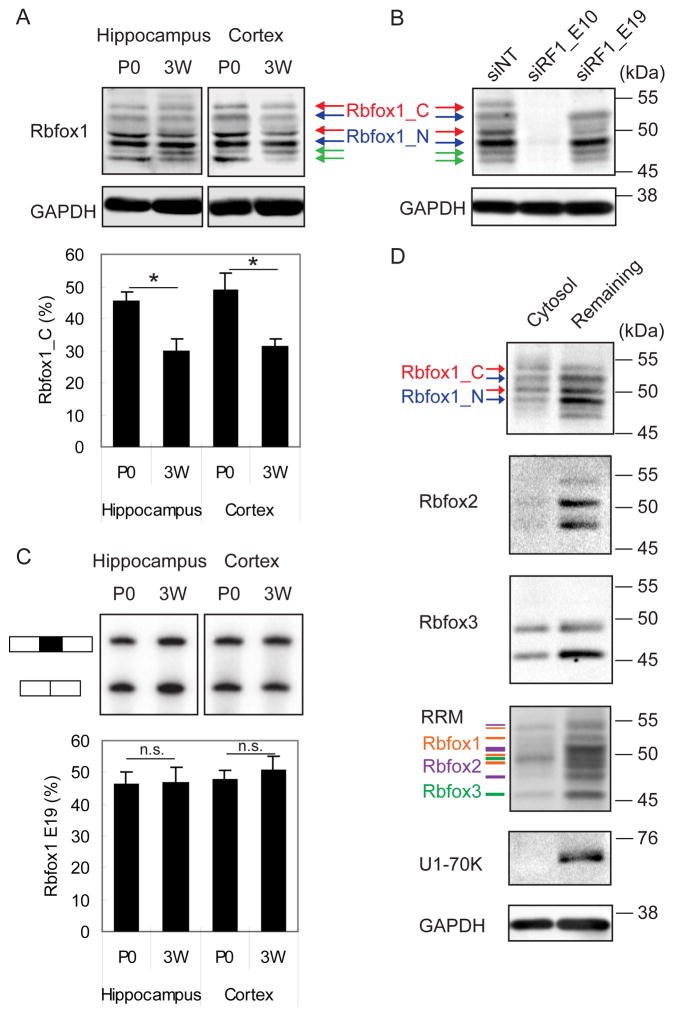
Figure 1. Expression and localization of Rbfox1 isoforms in neurons.
(A) Immunoblot of Rbfox1 isoforms during development in mouse hippocampus and cortex at postnatal day 0 (P0), and 3 weeks (3W). Cytoplasmic Rbfox1 isoform (Rbfox1_C) and nuclear Rbfox1 isoform (Rbfox1_N) are indicated by red and blue arrows, respectively. The green arrow points to a lower molecular weight isoform that is reduced by Rbfox1 siRNA (panel B), but whose provenance is unknown. The percentage of Rbfox1_C in the two dominant bands in the middle is shown in the bar graph below. Error bars indicate SD. N = 3. Statistical significance was determined by student’s t-test. * indicates p value < 0.05.
(B) Immunoblot of Rbfox1 using an Rbfox1 pan siRNA (siRF1_E10) and an Rbfox1_C specific siRNA (siRF1_E19) in hippocampal neurons (DIV17).
(C) Semi-quantitative PCR analysis showing the splicing of Rbfox1 exon 19 in the same tissue and at the same time points as in (A). The percentage of exon 19 splicing is shown in histogram. Error bars indicate SD. N = 3. The percentage of Rbfox1 exon 19 inclusion was calculated; student’s t-test, p < 0.05. n.s. = not significant.
(D) Immunoblot showing that Rbfox1 and Rbfox3 but not Rbfox2 are present in a cytosolic fraction purified from mouse hippocampal neurons (DIV14, treated with AraC). In the RRM immunoblots, the orange lines correspond to Rbfox1 proteins, the purple lines correspond to Rbfox2 proteins, and the green lines correspond to Rbfox3 proteins.

