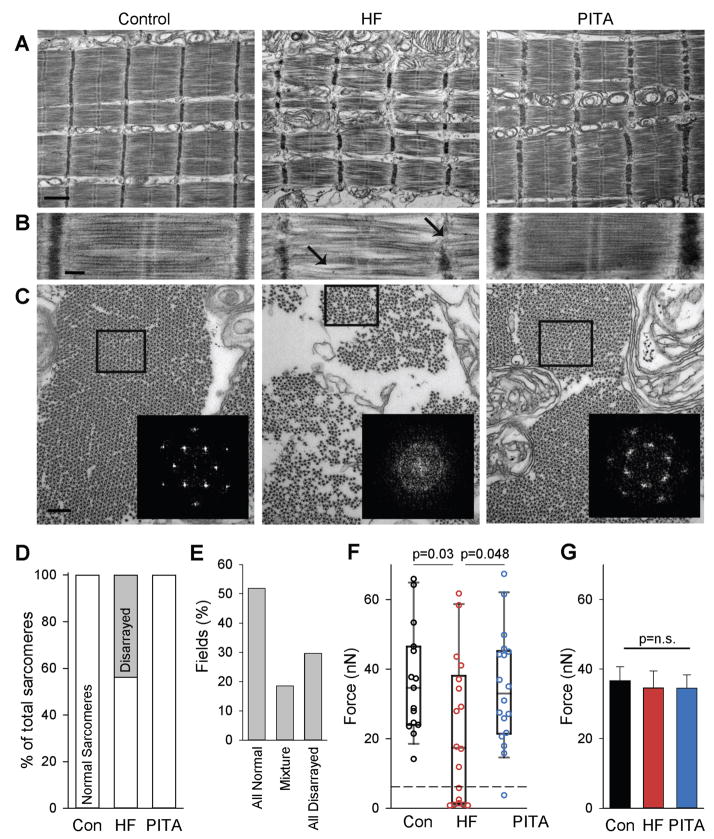
Figure 4. Myofilament structure and function is disrupted in HF, but restored in PITA.
(A) Longitudinal sections of skinned myocytes imaged by electron microscopy. Normal structures were observed in Control and PITA, but HF sarcomeres showed myofilament disarray. Scale bar, 1 μm. (B) Higher magnification highlighting the disrupted myofilament structures: weak and wavy Z-band and M-band, bent/curved filaments with irregular spaces between that were observed in some HF myofibrils, as indicated by arrows. Scale bar, 200 nm. (C) Transverse sections of myofilaments, showing smaller diameter of myofibrils with increased space between, and loss of regular filament lattice structure in HF compared with Control and PITA-treated animals. (inset) Fast-Fourier Transforms (FFTs) of boxed areas confirmed loss of normal lattice structure in HF group. Scale bar, 200 nm. (D) Percentage of normal and disarrayed sarcomeres identified by electron microscopy (n = 3727 sarcomeres examined from n = 3 HF dogs). (E) Disarrayed sarcomeres cluster together in HF. The percent of EM fields containing normal, disarrayed, or a mixture was quantified in the HF group (n = 28 fields). (F) Isolated myofibril force. A sub-population of fibrils generating extremely low force is indicated by the dashed line. Data are individual myofibrils and box plots, as HF data were non-normally distributed (n: Con = 15, HF = 18, PITA = 18 myofibrils). P values determined by Mann-Whitney Rank Sum non-parametric test. (G) Fmax compared after removing the weak myofibrils from (F) (n removed from the analysis: Con = 0, HF = 7, PITA = 1 myofibril). n.s., not significant by one-way ANOVA.

