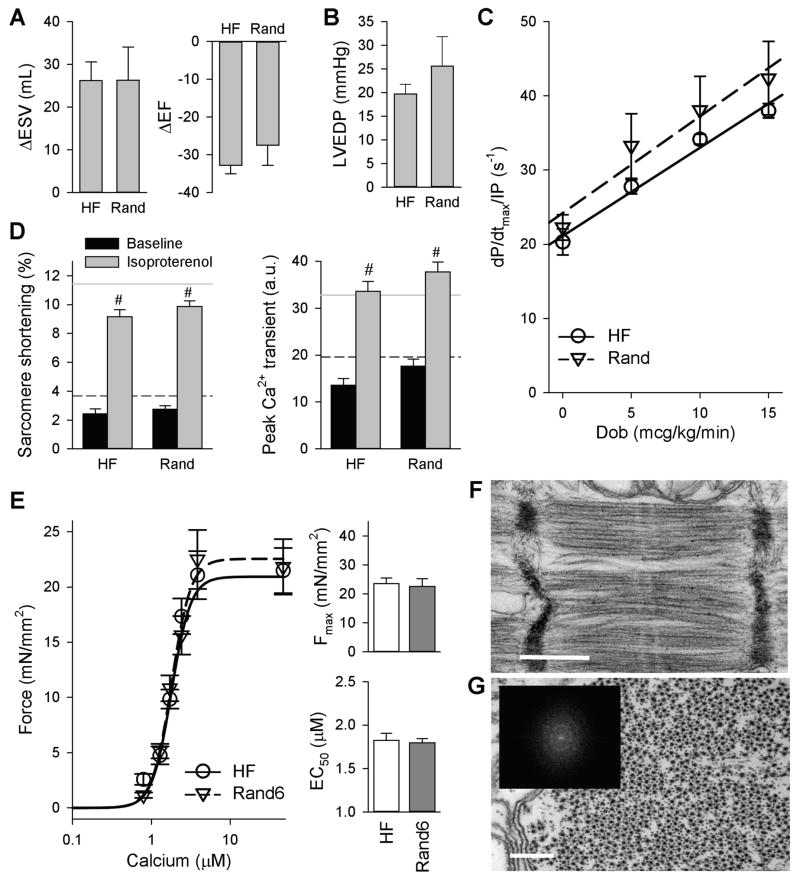
Figure 6. Randomly distributed RV pacing (dyssynchrony) does not confer beneficial effects compared to HF.
(A) Change in end-systolic volume (ΔESV) and ejection fraction (ΔEF) assessed by serial echocardiography at 6 weeks versus baseline. (B) Absolute LVEDP in random RV pacing in HF dogs. (C) The influence of dobutamine infusion on contraction (dP/dtmax/IP). In (A to C), data are means ± SEM (n: Rand = 6, HF = 5 dogs). (D) Peak sarcomere shortening and peak calcium transient at baseline and with isoproterenol stimulation in HF and Rand. Data are means ± SEM (n: Baseline HF: 13 cells from 4 dogs; Baseline Rand: 34 cells from 7 dogs; Iso HF: 30 cells from 4 dogs; Iso Rand: 71 cells from 7 dogs). Black dashed line: baseline control mean, gray line: isoproterenol-stimulated control mean. #p<0.05 vs. respective baseline by two-way ANOVA and Holm-Sidak post-hoc test. (E) Mean force as a function of calcium concentration (± SEM) and fitted curves for myocytes from the LV lateral wall for HF and Rand6 (six weeks of 6 h/day randomly distributed RV pacing). Summary data for Fmax and calcium sensitivity (EC50) are shown as means ± SEM (n: HF = 26 myocytes from 8 dogs, Rand6 = 10 myocytes from 3 dogs). (F) EM structural imaging of sarcomeres. Image is representative of n = 3. Scale bar, 500 nm. (G) Transverse EM image section, showing filament lattice structure. Scale bar, 200 nm. (Inset) FFTs confirmed loss of normal lattice structure.

