
Figure 1.
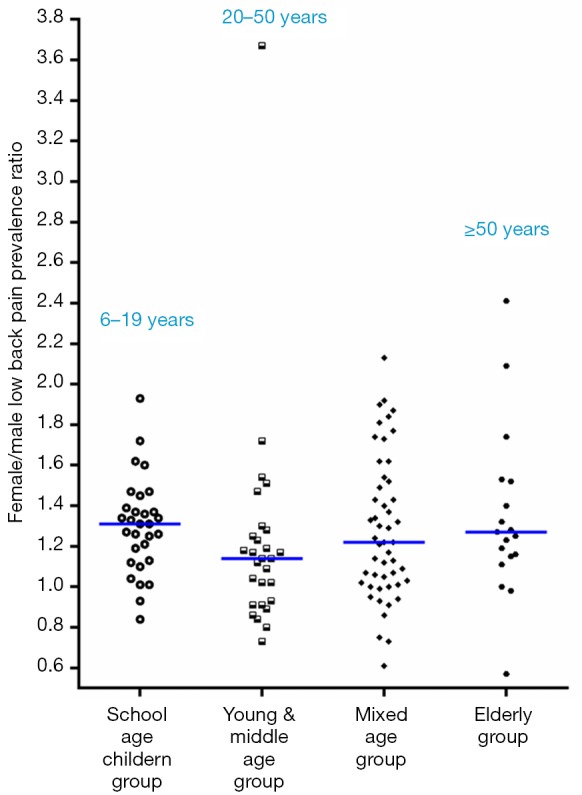
Female vs. male low back pain prevalence ratios in four age-specific groups; horizontal bars show the median values. Each individual study is represented as one entry regardless of their sample size.
Official websites use .gov
A
.gov website belongs to an official
government organization in the United States.
Secure .gov websites use HTTPS
A lock (
) or https:// means you've safely
connected to the .gov website. Share sensitive
information only on official, secure websites.
Female vs. male low back pain prevalence ratios in four age-specific groups; horizontal bars show the median values. Each individual study is represented as one entry regardless of their sample size.