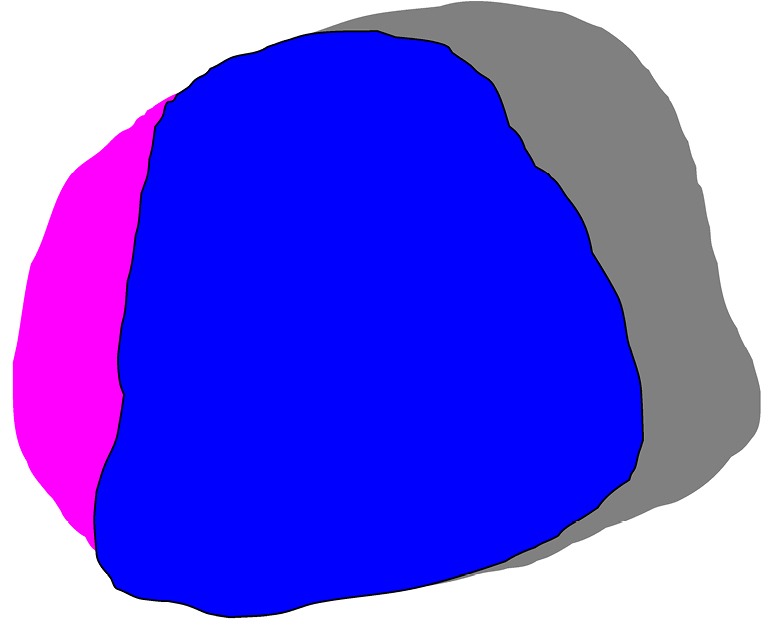
Figure 1.

Schematic diagram of a target volume on pCT and rCT scans. TV was manually delineated on pCT [TV_pCT (gray + blue)] and rCT [V_rCT (pink + blue)] scans; common [V_common (blue)] and union [V_union (gray + blue + pink)] volumes are shown from a single rCT axial slice. The OI of V_rCT on rCT scan was calculated by V_common/V_pCT, which presented the ratio of common volume and the volume of the targets in pCT. Dice similarity coefficients were calculated as 2× V_common/(V_rCT + V_pCT). pCT, planning CT; rCT, repeat CT; TV, target volume; OI, overlapping index; VrCT, the volume in the rCT; V_common, common volume; V_pCT, volume in pCT.
