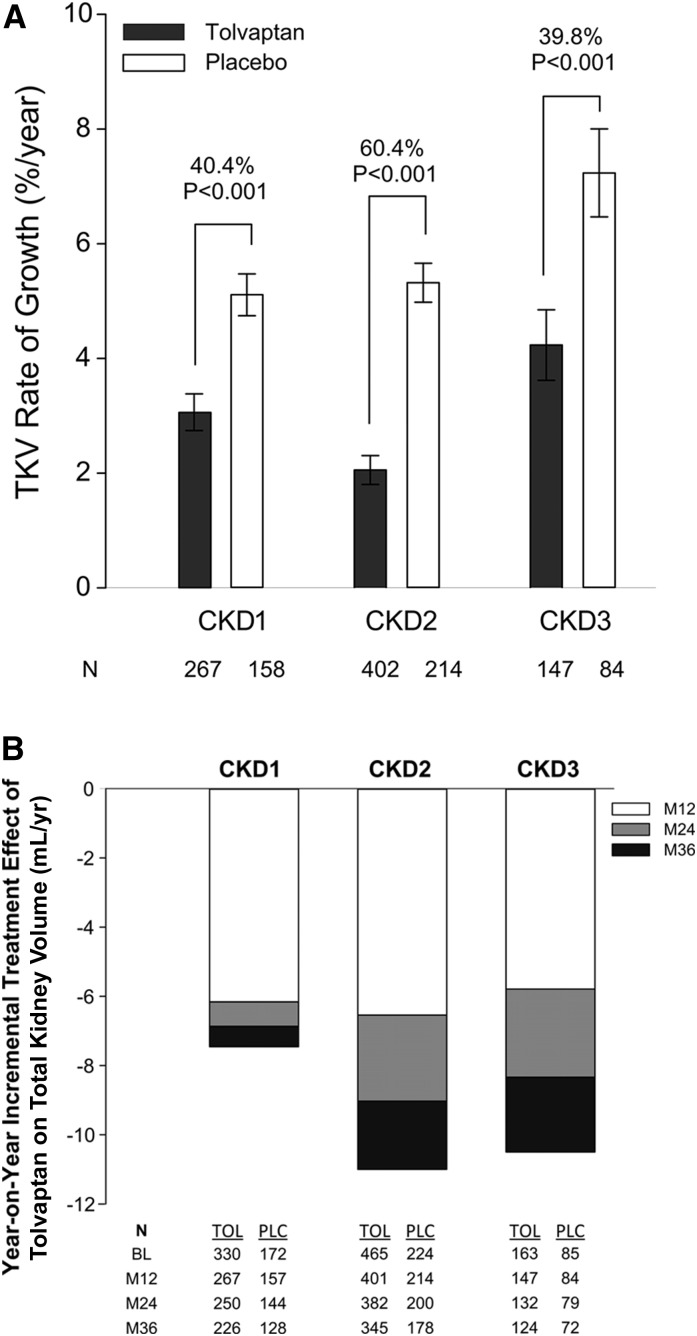
Figure 1.
Effect of tolvaptan on total kidney volume by CKD stage. (A) Annualized percentage changes in total kidney volume in the intention-to-treat population during the 3-year treatment period by CKD stage and treatment group (black bars refer to tolvaptan and white bars refer to placebo; mean ± SEM). Only the patients who had measurable baseline and at least one postbaseline magnetic resonance imaging scans were included in this analysis. The relative treatment effects (40.4%, 60.4%, and 39.8%) according to CKD stage subgroup are based on the between-group difference in the slopes, with variance approximated by means of the delta method under the assumption of independence between the slopes is indicated. (B) Year-on-year incremental treatment effect of tolvaptan on total kidney volume by CKD stage. Differences in least-squares mean total kidney volume changes for tolvaptan versus placebo on treatment by year. Annual treatment effects at months 12, 24, and 36 are represented by white, gray, and black/white dotted bars, respectively. CKD1, CKD stage 1; CKD2, CKD stage 2; CKD3, CKD stage 3; LS, least-squares; M, month; PLC, placebo; TOL, tolvaptan.

