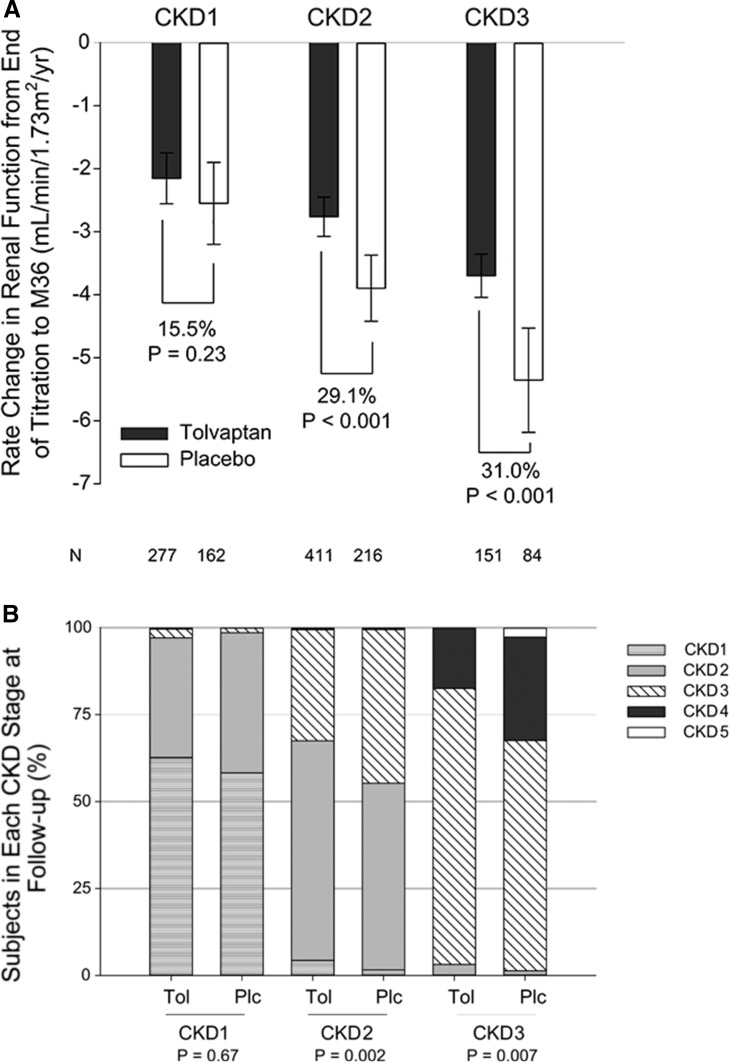
Figure 3.
Effect of tolvaptan on kidney function by CKD stage. (A) On-treatment slopes of eGFR (calculated by CKD-Epidemiology Collaboration [CKD-EPI]) with 95% confidence intervals by CKD stage and treatment group in the intention-to-treat population within the treatment period (black bars represent tolvaptan and white bars represent placebo). The relative treatment effects (15.5%, 29.1%, and 31.0%) according to CKD stage subgroup, based on the difference in annual change in slope, are shown. (B) Disease progression is plotted as a stacked bar chart for patients in CKD stages 1–3 at baseline compared with the last follow-up visit (eGFR estimated by CKD-EPI). P values were derived using Cochran–Mantel–Haenszel mean score statistic by baseline CKD Stage. EOT, end of titration; FU2, follow-up visit 2; M36, month 36; Plc, placebo; Tol, tolvaptan.

