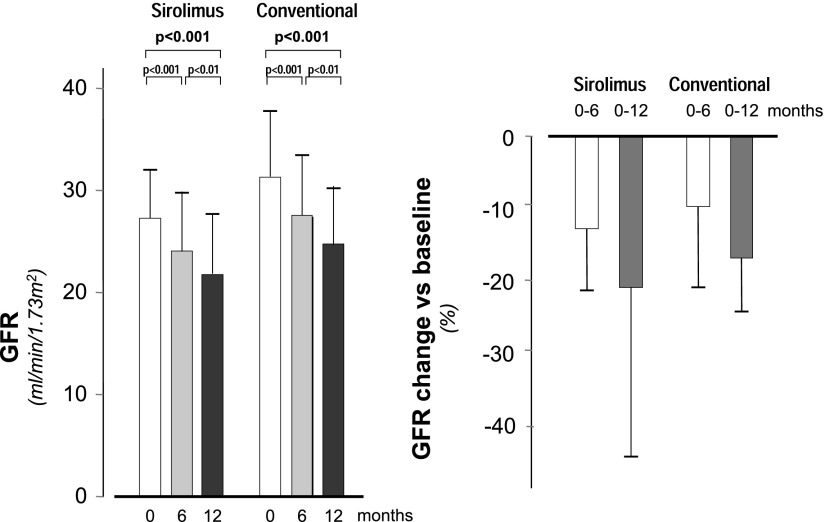
Figure 2.
GFR changes during the study according to treatment groups. Mean±SD. GFR at baseline and 6 and 12 months of follow-up (left panel) and percentage GFR changes at 6 and 12 months of follow-up versus baseline (right panel). GFR values at different time points and GFR changes versus baseline did not differ significantly between treatment groups.

