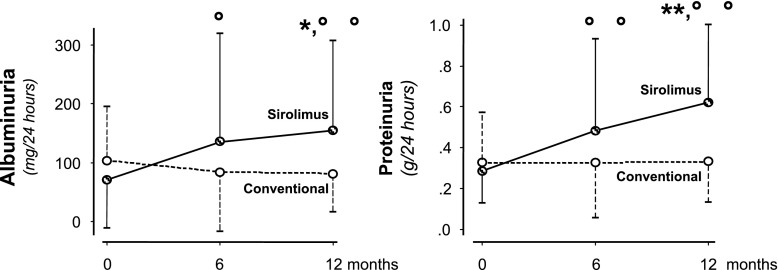
Figure 3.
Changes in twenty-four–hour albuminuria and proteinuria during the study according to treatment groups. Median (interquartile range) 24-hour albuminuria (left panel) and proteinuria (right panel) at baseline and 6 and 12 months of follow-up. Albuminuria and proteinuria both increased in the sirolimus group. At 12 months, changes in both parameters were significantly different between the two treatment groups. *P<0.05 versus conventional therapy (analysis of covariance); **P<0.01 versus conventional therapy (analysis of covariance); °P<0.05 versus baseline; °°P<0.01 versus baseline.

