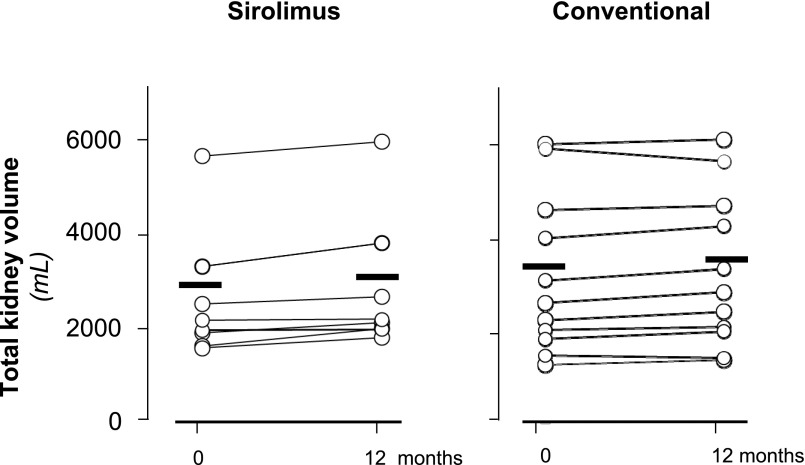
Figure 4.
Individual patient total kidney values at baseline and 12 months of follow-up according to treatment groups. No significant change was observed in the sirolimus (left panel) and conventional therapy (right panel) groups. Circles identify single-patient data, and horizontal thick lines denote mean values.

