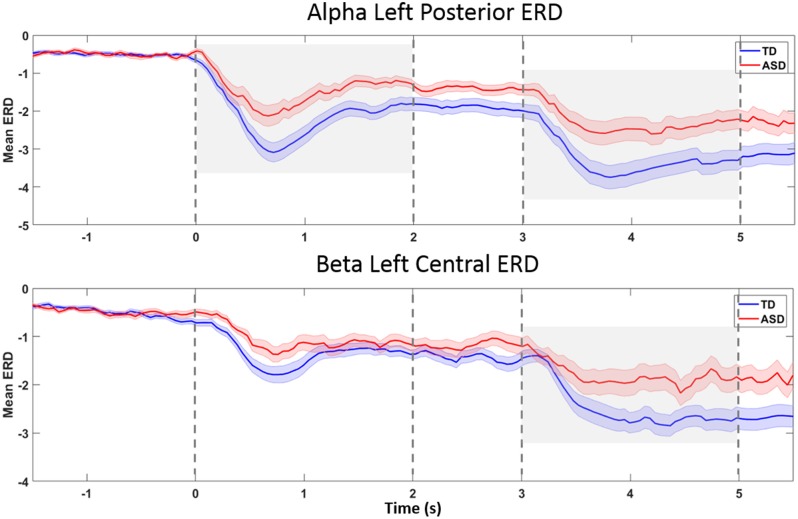
Figure 5.
ERD-over-time, in topographies and bands found to be different between groups. The x-axis reflects time (in seconds), and the y-axis represents ERD magnitude (in unitless z-scores). The grand average for the TD group is plotted in blue, and the grand average for the HFA group is plotted in red. Shaded areas around the mean (heavy line) represent standard errors. The Prepare phase ERD measurement in statistical calculations is the average from 0 to 2 s on the x-axis, and the Go phase, from 3 to 5 s. Plot A represents left posterior alpha ERD. Group differences were seen during both the Prepare and Go phases (gray shaded areas). In left central beta ERD (Plot B), the Go phase ERD was significantly different between groups (gray shaded area). The plots suggest that a delay in onset of ERD or temporal dispersion is unlikely to explain group differences in average ERD.

