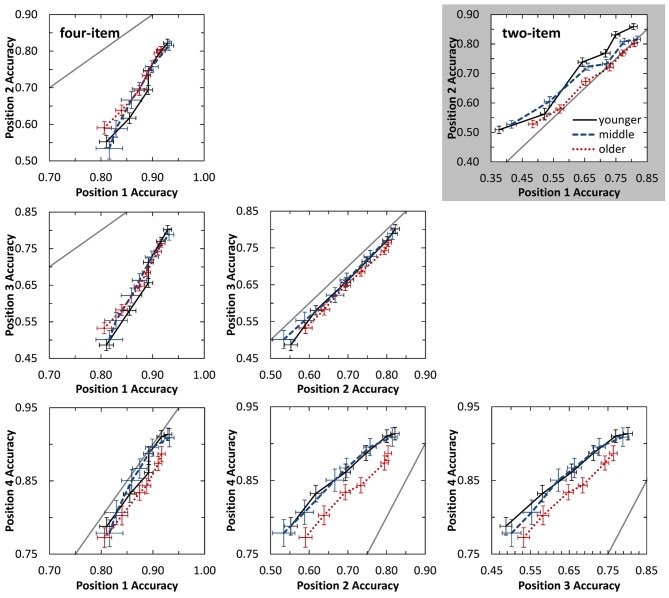
Figure 3.
State-trace plots displaying auditory identification accuracy for one sequence position against the accuracy for a different sequence position. The gray box displays performance for the two-item sequence, while white plots display performance for all position comparisons on the four-item task. Performance is plotted for the six different SOA values tested, with poorer performance obtained for shorter SOA values. The gray diagonal line plots equivalent performance for the two sequence positions. Performance below this line indicates better performance for earlier occurring items, while performance above the line indicates better performance for more later occurring items. Error bars indicate standard error of the mean.

