
Figure 7.
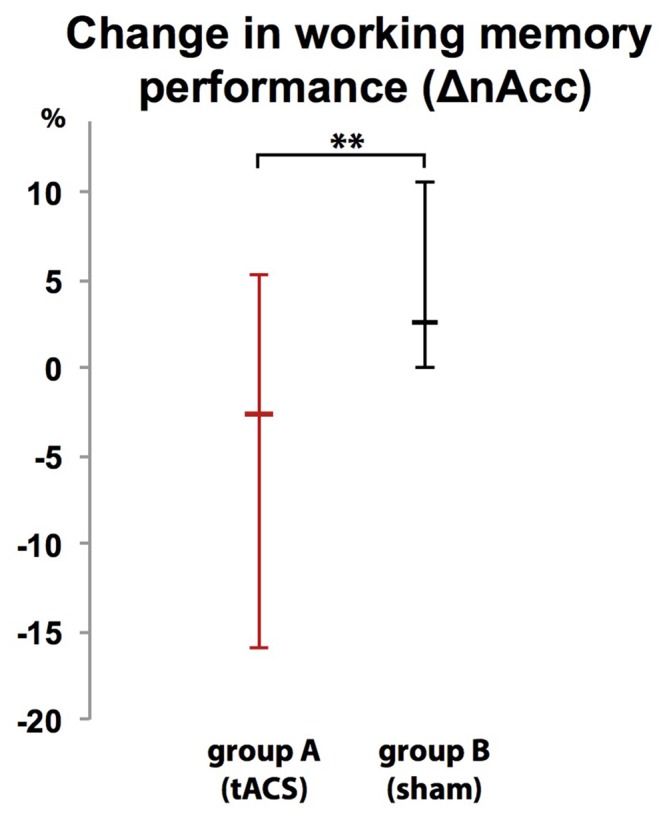
Group-dependent difference in WM performance as measured as difference in correct responses in a 2-back task between a baseline block (block 1) and interventional block (block 2). WM performance dropped when tACS was applied (group A) but not during sham stimulation (group B). Error bars indicate 95% confidence intervals. **p < 0.01.