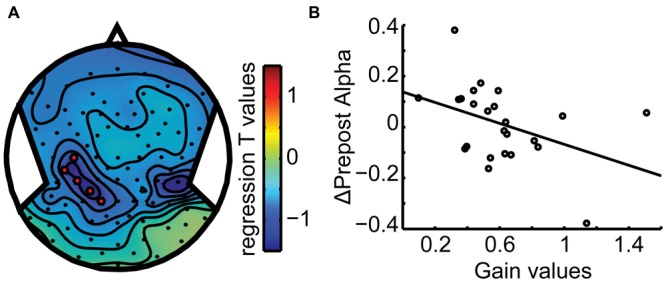
FIGURE 7.

Behavioral Correlation. (A) Scalp topography plot of the regression t-value distribution for the gain-alpha pre–post analysis. A left parieto-temporal cluster (C3, CP6, CP3, P1, CCP5h, and CPP3h) shows a significant negative correlation (B) with gain values (r = -0.41). Data points mark subject averages of gain and pre–post alpha modulation over the three displacements. This indicates that higher performance (gain) goes along with a larger modulation of alpha band activity, specifically more alpha reduction after motion.
