
Figure 2.
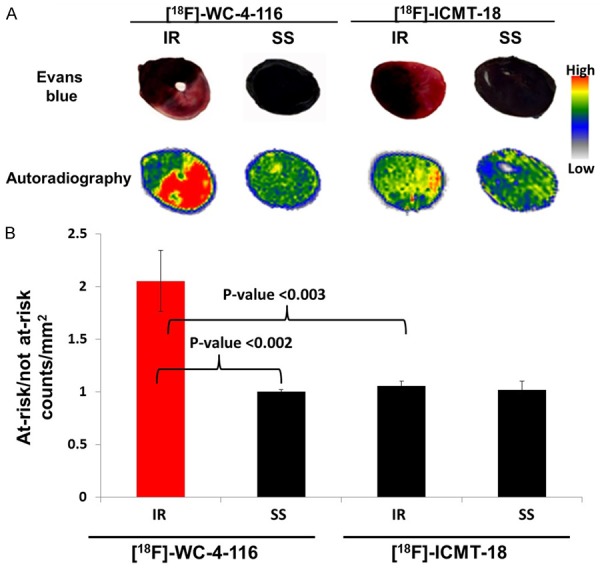
Autoradiography of IR and SS animals administered the tracers [18F]WC-4-116 or [18F]ICMT-18 and representative Evan’s Blue stained cardiac sections (A) Quantitation of tracer accumulation from autoradiography studies (counts/mm2) of the at-risk and not at-risk myocardial regions are shown graphically (B). Bonferroni-adjusted p-values for pair-wise comparisons are indicated.