
Figure 4.
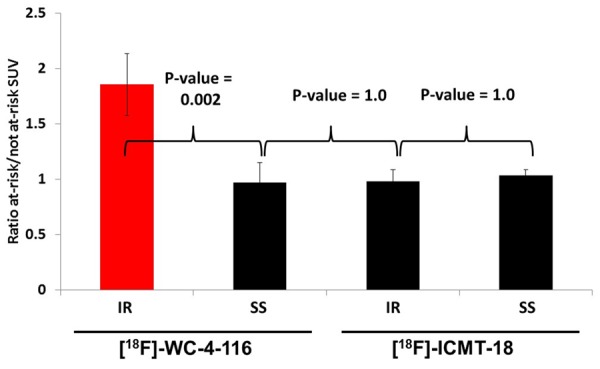
SUV analysis of microPET images. Mean SUV of the at-risk and not at-risk myocardial regions of the experimental imaging groups were measured and the mean ratio of SUVat-risk: SUVnot at-risk (± standard error) was derived. All treatments are n = 4 except for the IR group imaged with [18F]ICMT-18 (n = 3) with a p-value (ANOVA) = 0.002 for interaction between tracer and treatment type. Bonferroni-adjusted p-values for pair-wise comparisons are indicated.