
Figure 5.
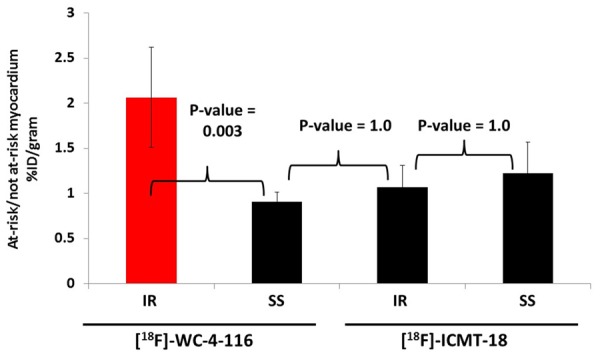
Biodistribution studies. %ID/g of the at-risk and not at-risk myocardial samples derived from the experimental imaging groups was measured and the mean ratio of %ID/gat-risk: %ID/gnot at-risk (± standard error) was derived. All treatments are n = 4 except for the SS group imaged with [18F]ICMT-18 (n = 3) with a p-value (ANOVA) = 0.003 for interaction between tracer and treatment type. Bonferroni-adjusted p-values for pair-wise comparisons are indicated.