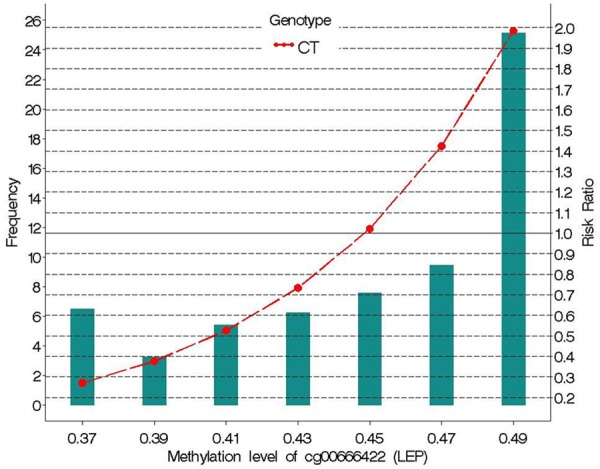
Figure 3.

Risk ratio of asthma at age 18 versus methylation of the LEP CpG site cg00666422, for rs11763517 genotype CT relative to TT or CC (combined). The horizontal axis represents bins of DNA methylation and the green bars represent the frequency for those DNA methylation bins. The CT genotype (red dots) is plotted against asthma relative risk. The reference genotype was TT and CC combined.
