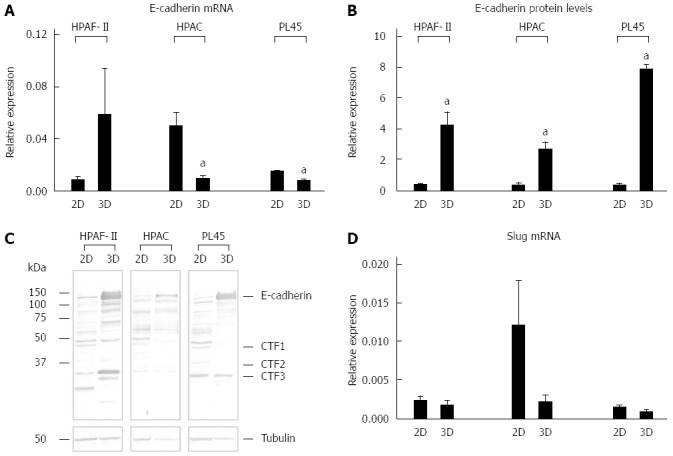
Figure 8.

E-cadherin gene and protein expression, and Slug mRNA levels. Bar graphs showing E-cadherin gene (A) and protein expression (B) analyzed by real-time PCR and Western blot, respectively. Data are mean ± SD of duplicate samples run in duplicate experiments; C: Representative Western blot showing the electrophoretic pattern of E-cadherin in lysates obtained from HPAF-II, HPAC, and PL45 cells grown in 2D-monolayers or 3D-spheroids; D: mRNA levels for Slug in PDAC cells assayed by real time PCR. Data are mean ± SD of duplicate samples run in duplicate experiments. a: Cohen’s d > 2.
