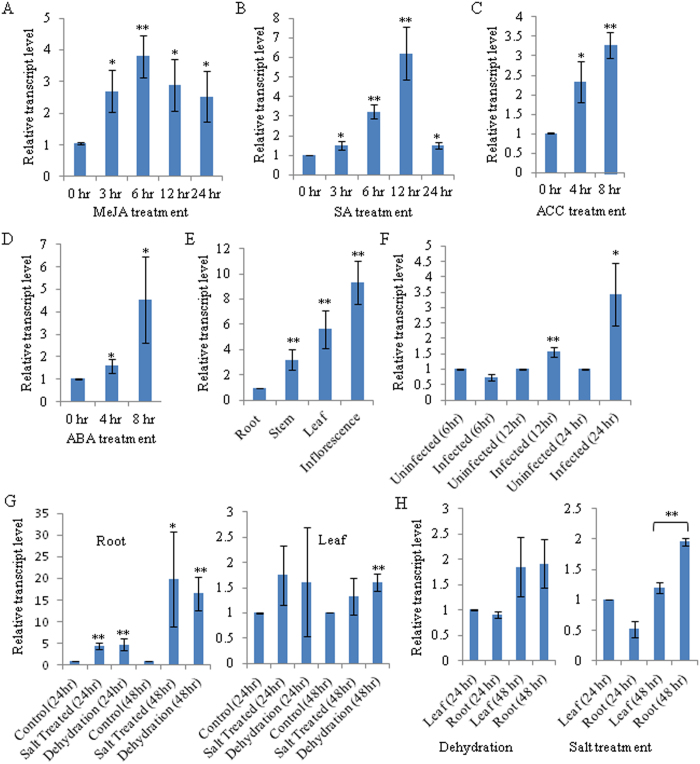
Figure 1. ObTLP1 transcript expression pattern in O. basilicum.
(A–D) MeJA, SA, ET and ABA-inducible expression of ObTLP1 was determined by qRT-PCR analysis. (E) Transcript expression pattern of ObTLP1 in different plant organs was determined by qRT-PCR. (F,G) ObTLP1 transcript expression in leaves after S. sclerotiorum infection (F), and in roots and leaves after dehydration and salt stress (G), was determined by qRT-PCR. (H) Relative transcript level of ObTLP1 in roots and leaves after dehydration and salt stress. Data are mean ± s.d. (n = 3 to 4). Asterisks indicate statistically significant difference at **P < 0.01 and *p < 0.05 using two-tailed Student’s t-test.

