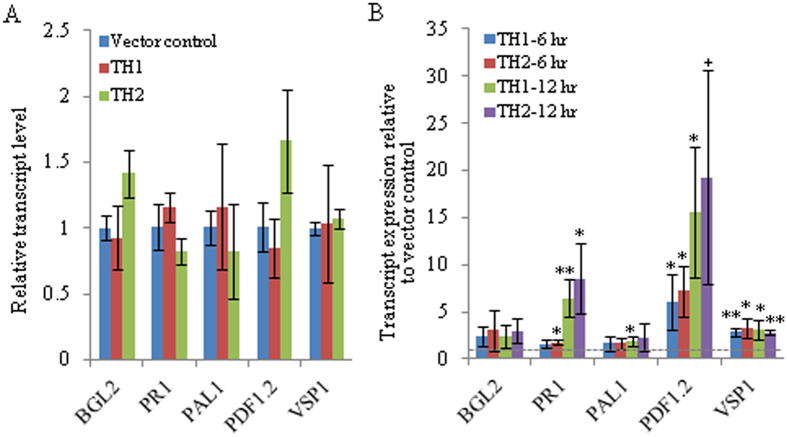
Figure 8. Expression patterns of the defense marker genes in ObTLP1-expressing Arabidopsis.
(A) Relative transcript level was determined in uninfected leaves. Data are mean ± s.d. (n = 4, from two biological samples). (B) Relative transcript level was determined in S. sclerotiorum infected leaves. Data are presented as fold expression relative to the vector control for each time points. Data are mean ± s.d. from three biological replicates. Asterisks indicate statistically significant difference at **P < 0.01 and *p < 0.05 using two-tailed Student’s t-test. ‘+’ denotes P value of 0.051.

