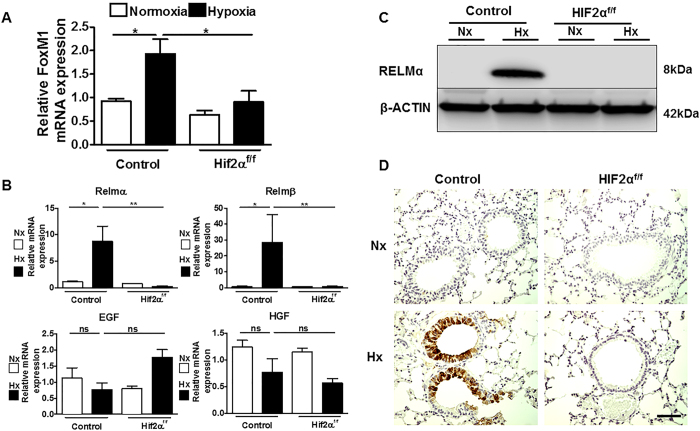
Figure 4. Hypoxia induces FoxM1 and RELMα in hypoxic lungs through HIF2α.
(A) Relative FoxM1 mRNA levels (normalized to those of Hprt) in the lungs of control mice exposed to normoxia (n = 4) or hypoxia 10% O2 (n = 6) for 3 days or HIF2α -deficient mice exposed to normoxia (n = 3) or hypoxia 10% O2 (n = 4) for 3 days. (B) Relative RELM-α , RELM-β , EGF and HGF mRNA levels (normalized to that of Hprt) in the lungs of control mice exposed to normoxia (n = 3) or hypoxia 10% O2 (n = 4) for 3 days or HIF2α -deficient mice exposed to normoxia (n = 3) or hypoxia 10% O2 (n = 4) for 3 days. (C) Western blot analysis of RELM-α and β –actin protein levels in the lungs of control or HIF2α -deficient mice exposed to normoxia or hypoxia (10% O2) for 3 days. A representative western blot is shown. (D) RELM-α immunohistochemistry in lung sections of control or HIF2α -deficient mice exposed to normoxia or hypoxia (10% O2) for 3 days. For (A,B) panels values are expressed as mean ± SEM and n is the number of the animals analysed. Error bars show 95% confidence interval based on duplicated samples. One-way ANOVA Tukey’spost test was used for statistical analysis. *p < 0.05; **p < 0.01; ns (not significant). For (D) panel, scale bar: 50 μ m.

