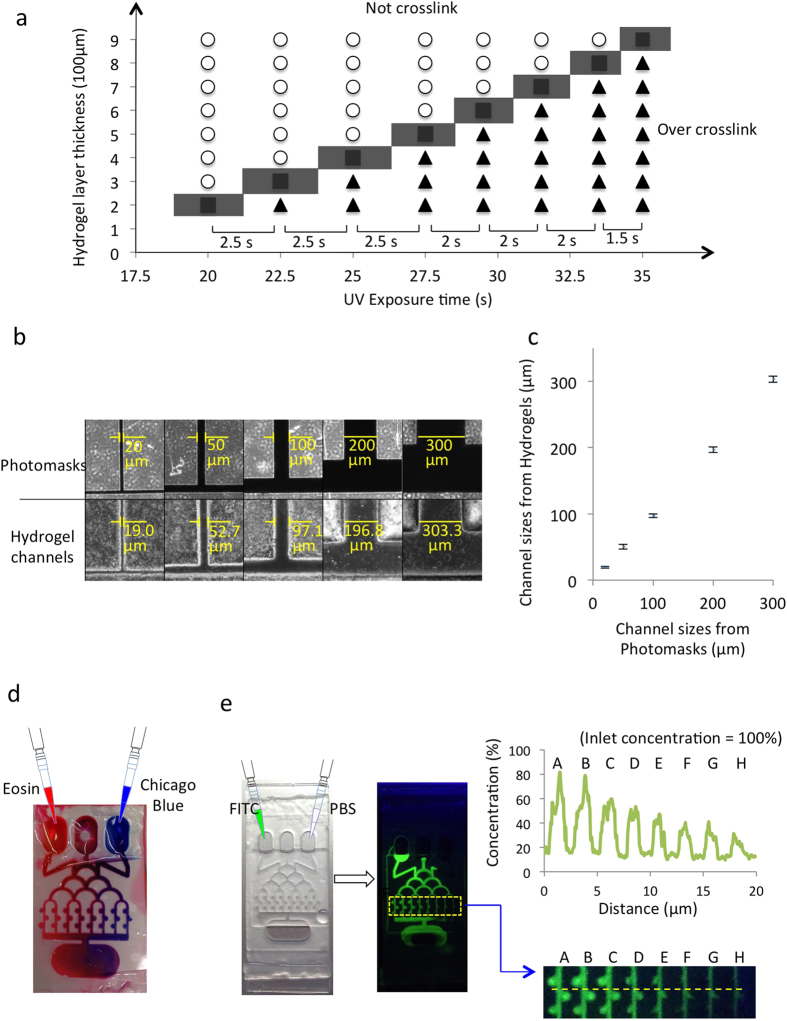
Figure 2. Characterization of the brain cancer chip.
(a) Diagram for the optimization of PEGDA hydrogel layer thickness and UV exposure time for cross-linking PEGDA. Circles indicate exposure times that did not result in fully cross-linked PEGDA hydrogel, triangles indicate over-cross-linking in which the channels were blocked, and squares indicate the optimal time for crosslinking PEGDA hydrogel. (b) Images of photomasks with different channel widths and their resulting hydrogels. Channels were observed from top view. (c) Quantitative results of channel widths produced in the PEGDA hydrogel versus their corresponding photomasks. (d) Combinatorial screening of solutes from inlets via microfluidic networks. Eosin (red) and Chicago blue (blue) were injected into the two outer inlets. Color in the microchannels changed from red (left) to blue (right). (e) Fluorescent imaging of FITC in hydrogel microfluidic channels after simultaneous injection of FITC (left) and PBS (right). The concentrations of FITC solution in different microchannels were calculated by comparing fluorescent intensities between each microchannel and the inlet.

