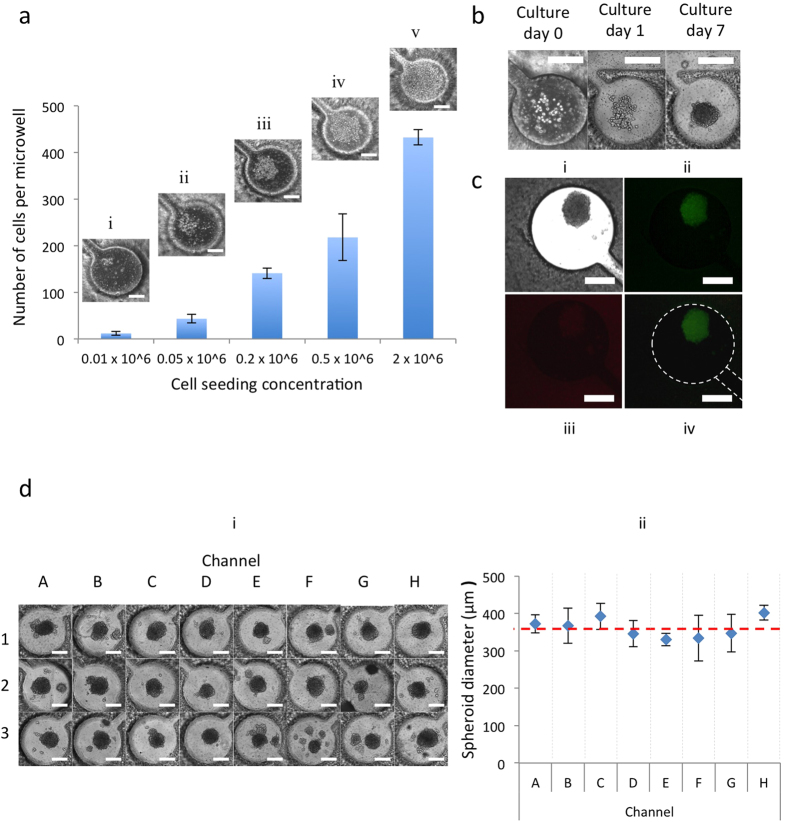
Figure 4. GBM cell capture, culture and 3D-spheroid formation.
(a) Optimization of initial cell-seeding concentrations. Cells in each microwell were counted 30 minutes after the injection. Error bars represent standard error of the mean. Scale bar, 200 μm. (b) U87 cells were injected into the microfluidic network from the inlets and captured in the microwell. Cells were cultured in DMEM and aggregated to form cancer spheroids. Scale bar, 200 μm. (c) Bright field and fluorescence micrograph showing cancer spheroid. (ii) Staining of live cells with 4 mM Calcein AM (green) and (iii) dead cells with 2 mM ethidium homodimer-1 (red). (iv) Merged image of stained cancer spheroid. (d) GBM spheroids in microwells of brain cancer chip (i) showed a uniform size (361.3 ± 36.2 μm-diameter) (ii). Scale bar, 200 μm.

