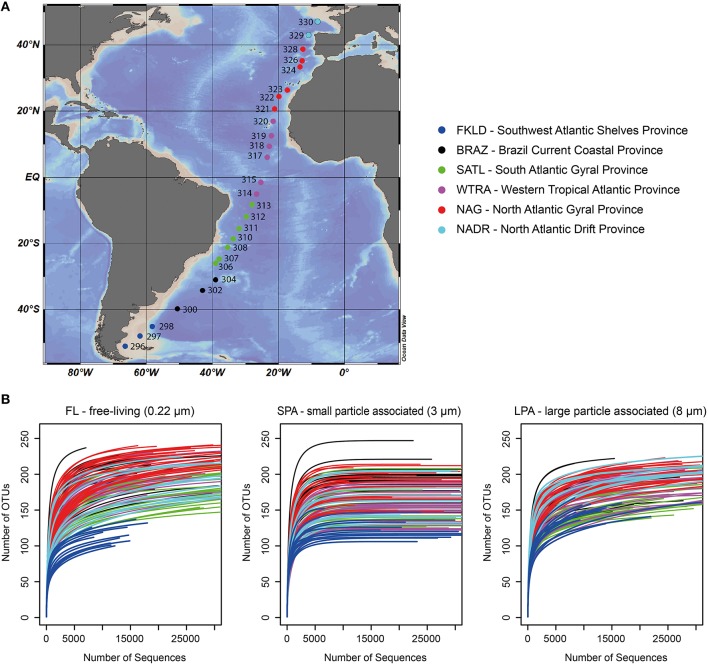
Figure 1.
Sampling sites and rarefaction analysis. (A) Sampling sites across the Atlantic Ocean; for each station the original sampling ID is reported. (B) Rarefaction analysis for the three size fractions of bacterioplankton. The number of sequences per sample was limited to 30,000 sequences, the original raw data can be found in Table S3. For both panels color code distinguishes the six oceanographic provinces.

