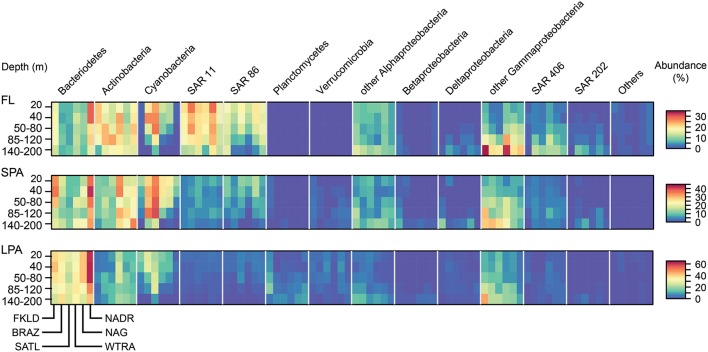
Figure 2.
Relative abundance of marine taxonomic groups of bacteria for the six oceanographic provinces across the whole photic zone and for three different size fractions. The relative abundances of the main taxonomic groups (expressed in percent of total) were averaged for each province for all the five depth layers. OTUs were combined at the phylum level for most of the taxonomic groups, only Proteobacteria were grouped at the class level as same in all other figures. Important marine clades are shown separately because of their strong contribution to the bacterial communities. The remaining groups or unclassified bacterial OTUs are shown as “Others.” The heat map for each taxonomic group shows the five depth layers on the y-axis from the top to the bottom, and the six oceanographic provinces on the x-axis from South to North. Each taxonomic group is therefore composed of a block consisting of six times five rectangles, encompassing the provinces and depth layers, respectively. The three size fractions of the bacterioplankton (FL, SPA, LPA) are shown in three separate panels from top to bottom.

