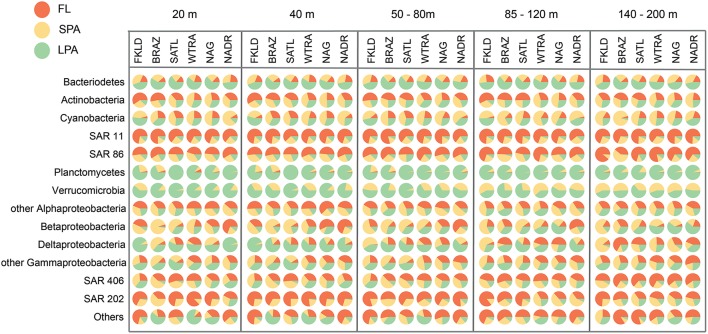
Figure 3.
Predominance of taxa in the different size classes of the bacterioplankton communities. Each circle represents the average number of reads for the respective taxon, depth, and oceanographic province which was set to 100%. The percentage of reads from the three size fractions is shown by the area of the pie segments.

