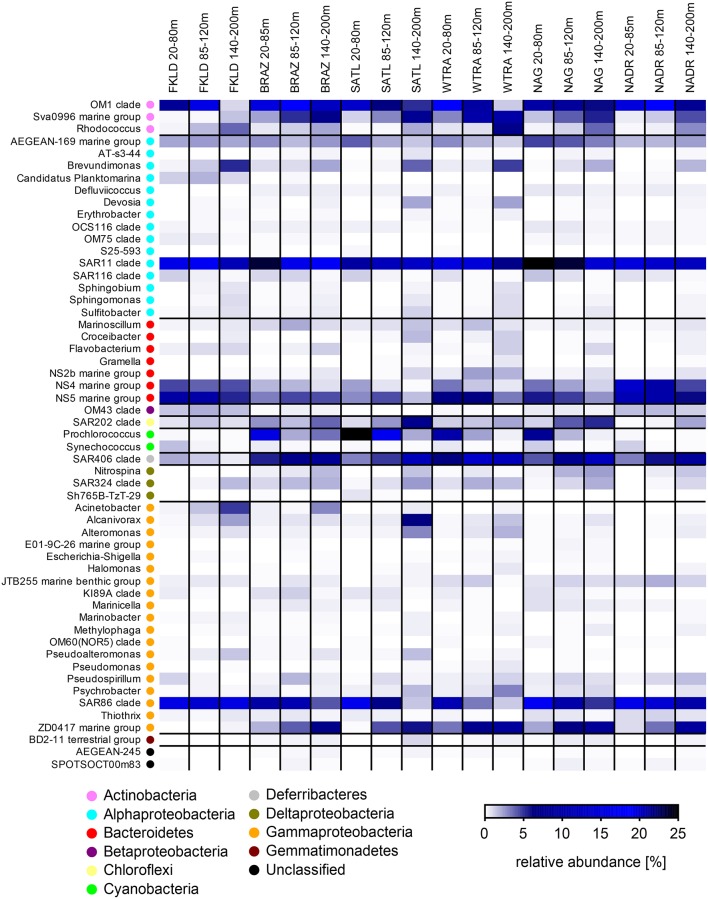
Figure 4.
Relative abundance of free-living (FL) marine bacterial clades and genera for the six oceanographic provinces across the whole photic zone: Relative abundance of OTUs classified at the genus and clade level was averaged for the six oceanographic provinces in three depth layers (20–80, 85–120, and 140–200 m). Each line of the heat map represents a taxon, and its higher taxonomic rank (phylum or class) is indicated by the color key.

