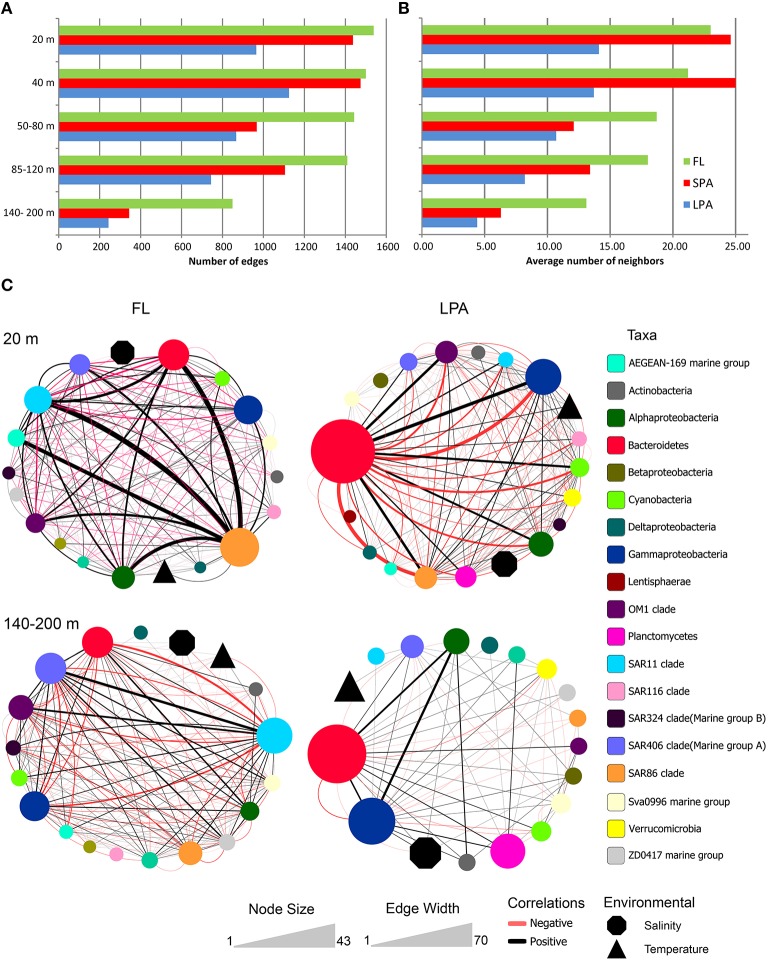
Figure 6.
Bacterioplankton co-occurrence networks. Network analysis was performed at the OTU level for each depth layer and size fraction of the plankton. Selected topological parameters of the networks are plotted: (A) Number of edges in each network and (B) average number of neighbors per node. See Tables S8–S10 for the full set of network parameters. (C) The four most extreme networks are displayed: The 20 and 140–200 m depth layer (top to down) of the FL and LPA communities (left to right), respectively. In order to better display co-occurrence patterns OTUs were grouped at different taxonomic level (known marine clades as well as classes and phyla). The size of each oval (node) indicates the number of OTUs belonging to that taxonomic group, while the size of environmental parameters (temperature and salinity) was arbitrary defined. Lines connecting two nodes represent a group of strong (R > 0.6) and significant correlations (p < 0.05). Black lines indicate a positive correlation while red lines indicate a negative correlation. The width of each line exhibit the number of correlations occurring among the two connected nodes.

