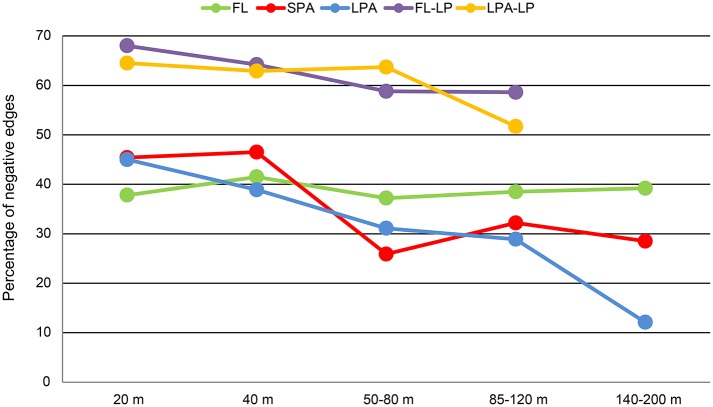
Figure 7.
Bathymetric distribution of negative correlations. For each of the networks generated (15 bacteria-bacteria networks and 8 bacteria-micro-eukaryotes networks) the relative amount of negative correlations is plotted against depth. Different colors distinguish the networks: FL, free-living bacteria; SPA, small particle associated bacteria; LPA, large particle associated bacteria; FL-LP, free-living bacteria and micro-eukaryotes retrieved from the 8 μm membranes; and LPA-LP, large particle associated bacteria and micro-eukaryotes retrieved from the 8 μm membranes.

