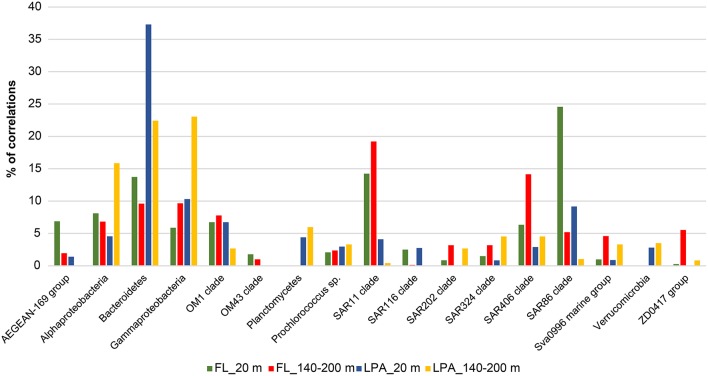
Figure 8.
Relative contribution to the total number of correlations for different taxonomic groups for the depth stratified networks: Network analysis was performed at the OTU level for each depth layer and size fraction of the plankton as described in Materials and Methods. Nodes belonging to the same taxonomic group (known important marine clades as well as classes and phyla of the bacterioplankton) were grouped together and the relative amount of correlations was calculated and expressed as percentage of the total number of correlations of the network. Four networks are here displayed (FL_20, FL_140-200, LPA_20, and LPA140_200 m) with different colors.

