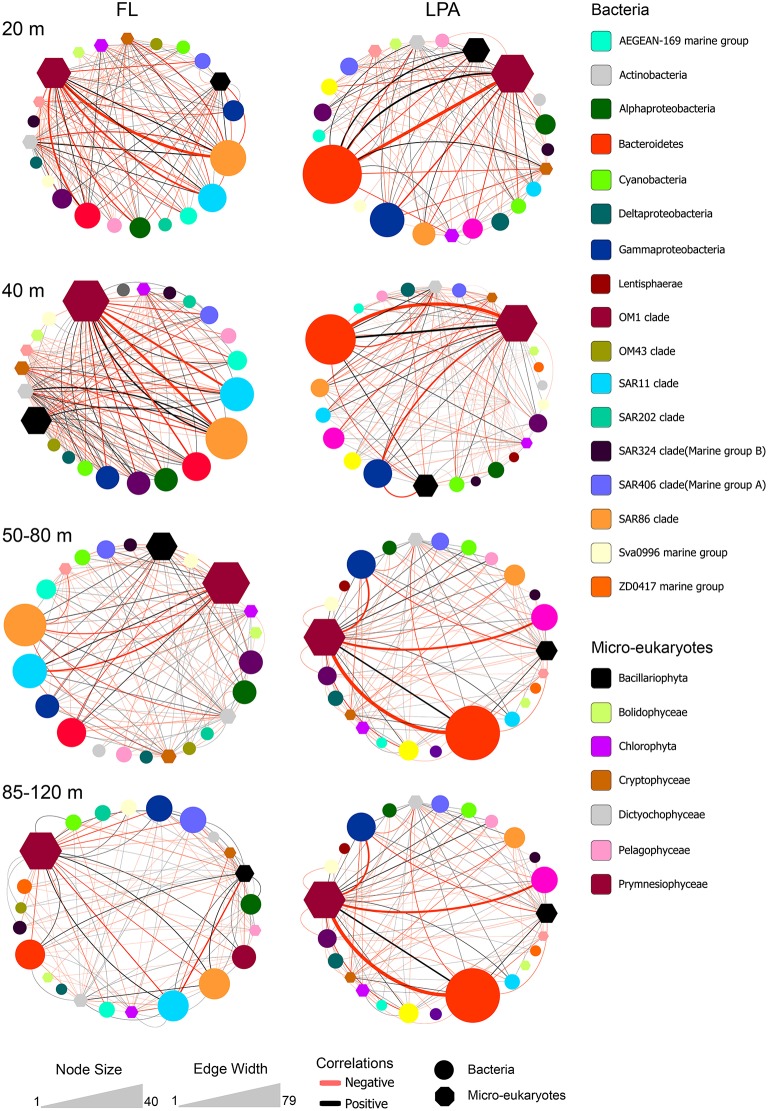
Figure 9.
Bacterial co-occurrences with micro-eukaryotes. Correlations between micro-eukaryotes and bacteria were calculated at the OTU level for four different depth layers: 20, 40, 50–80, and 85–120 m (top to bottom) between the bacterial OTUs of the FL (left) and LPA (right) communities with the micro-eukaryotes retrieved on the 8 μm filters (LP). Color code indicates the taxonomic assignment of each node while the shape distinguishes between bacteria and micro-eukaryotes (oval or hexagon). The size of each node reflects the number of OTUs affiliated to each taxon. Co-occurrences between taxa are displayed by lines. The width of each line indicates the number of correlations occurring among the two connected nodes, while the color reflects positive (black) or negative (red) associations.

