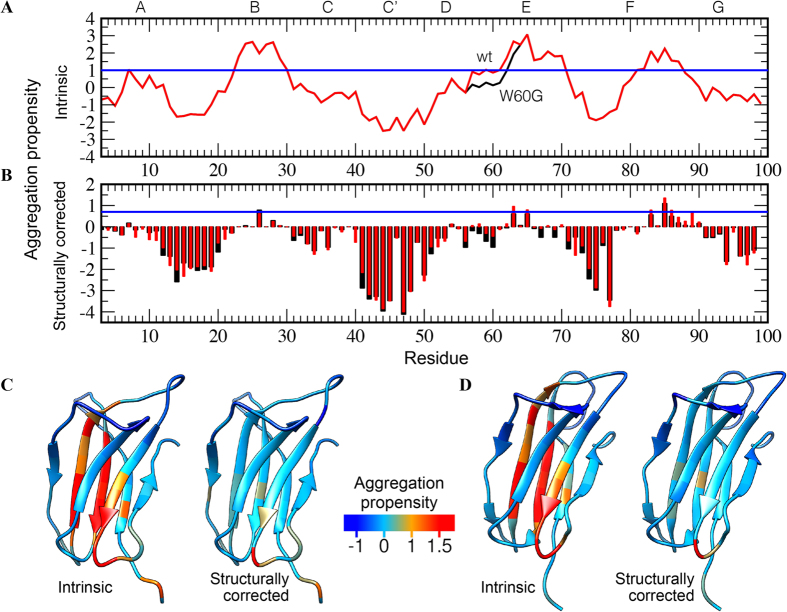
Figure 3. Predicted aggregation properties of β2m wild-type and W60G variants.
(A) Intrinsic aggregation profiles of the wild-type (red) and W60G (black) variants. (B) Structurally corrected profiles calculated as ensemble averages for β 2m wild-type (red bars) and W60G (black bars). In (A,B) values larger than 1 denote aggregation-prone regions. (C) Projection on the structure of wild-type β 2m of the intrinsic profile (left) and the structurally corrected profile (right). The color code is blue for aggregation-resistant residues and red for aggregation-prone residues. (D) Same as (C) for the structure of W60G β 2m.

