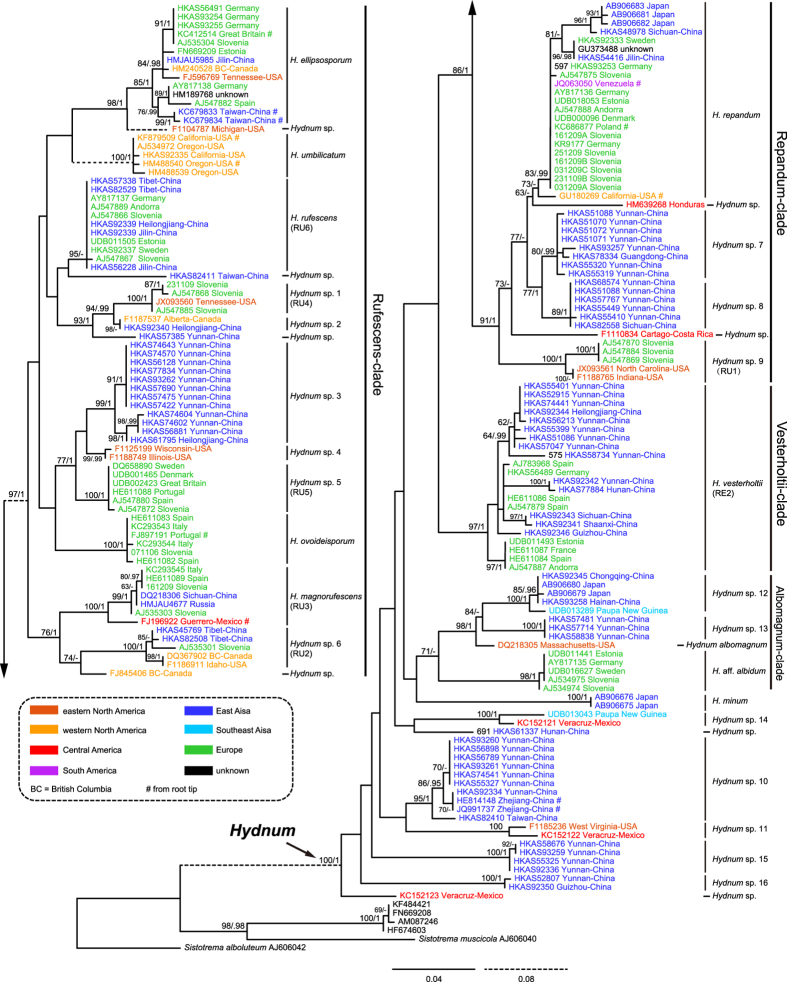
Figure 1. Phylogenetic tree inferred from the Maximum Likelihood (ML) analysis based on the ITS dataset I.
Bootstrap values (ML)/posterior probabilities (from Bayesian Inference) are shown above or beneath individual branches. Only bootstrap values larger than 60 and posterior possibilities over 0.95 are shown.

