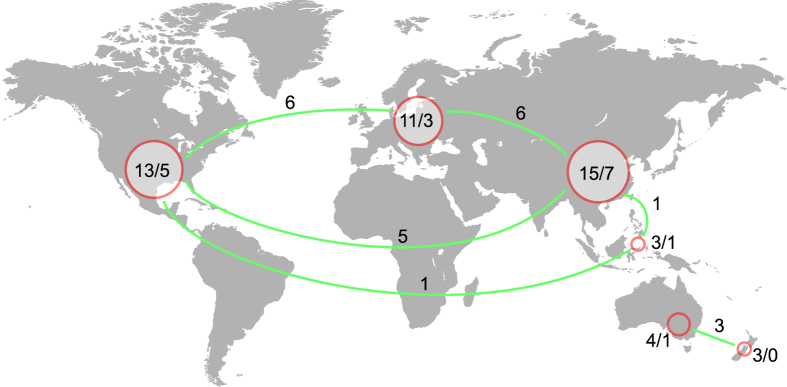
Figure 5. A map showing the disjunct distribution of Hydnum species.
Cycles show different continents, while the numbers in or near each of these cycles indicate the total/endemic (phylogenetic) species in certain continents. The numbers above the green lines reveal the number of species shared by pairs of continents. The map was generated using the free application maptools v0.8–39 (http://CRAN.R-project.org/package=maptools) in the R environment and then modified in Adobe Illustrator CS6 (Adobe Systems Inc., CA, USA).

