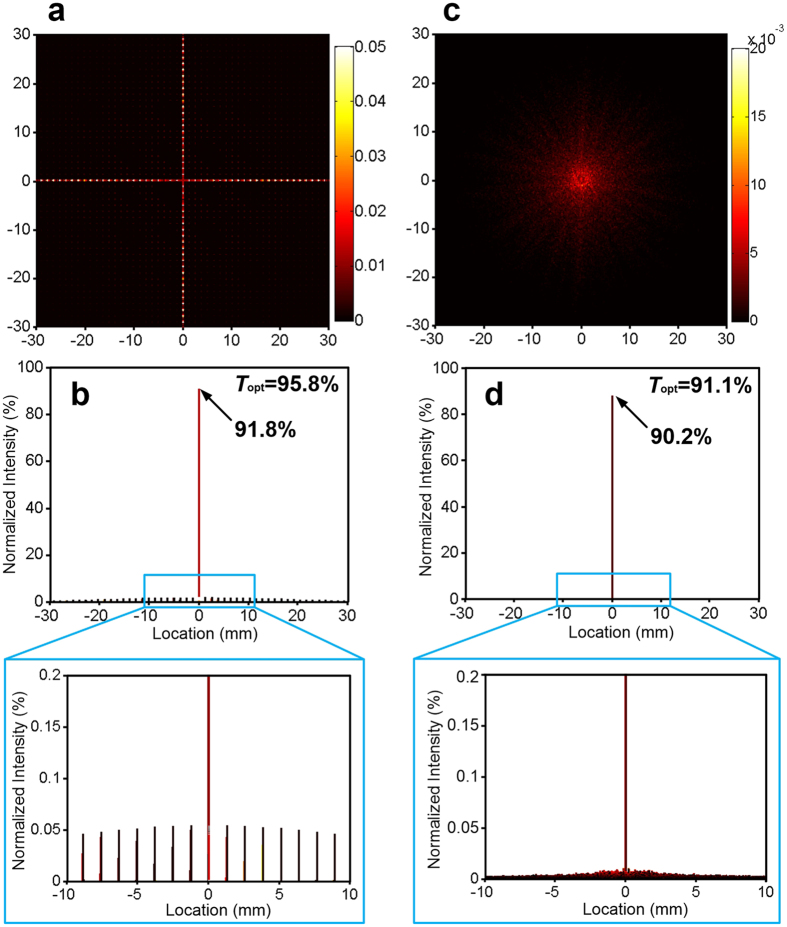
Figure 3. The simulated stray light distributions of square mesh and CT-MM.
(a,c) Diffraction pattern spectrograms of (a) the square mesh sample (g = 250 μ m and w = 5 μ m) and (c) the CT-MM film (CT-MM3). (b,d) Normalized intensity spectra of diffraction spots related to the diffraction patterns and their partial enlarged drawings, respectively.

