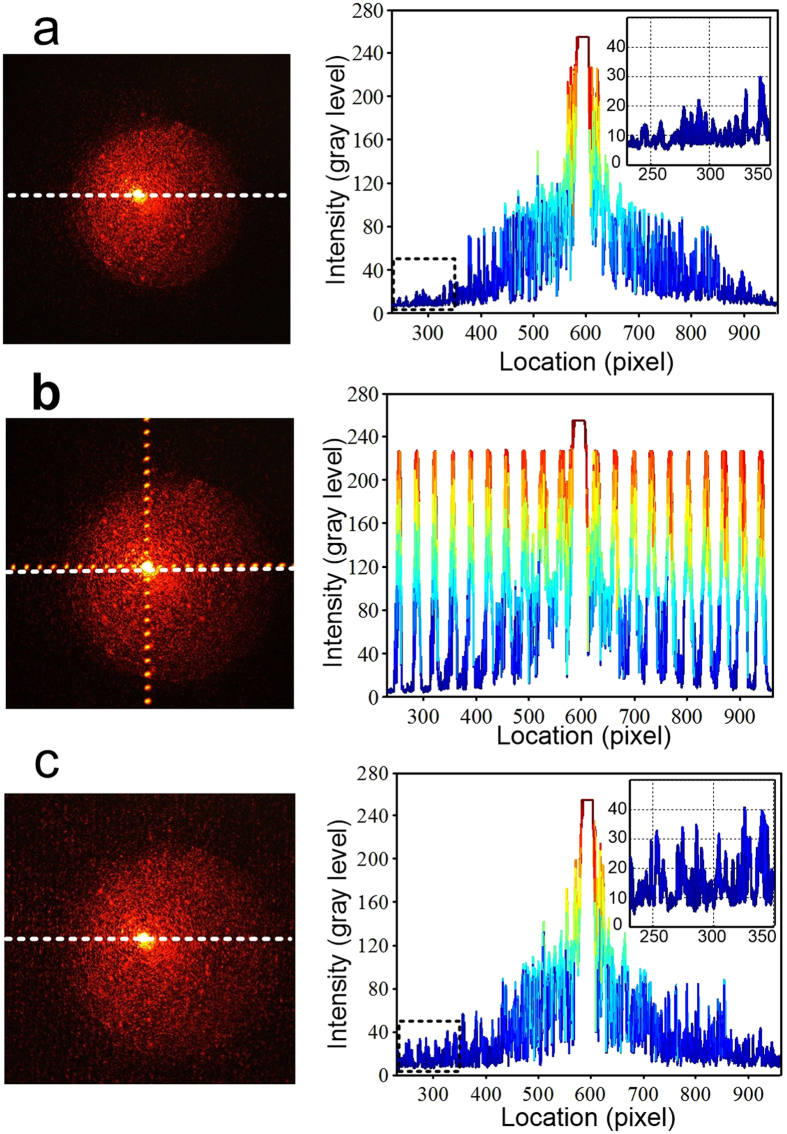
Figure 4. Stray light distribution testing with different samples.
Detected diffraction patterns with digital grey level graphs (along dash lines) of (a) a bare quartz, (b) a square mesh/quartz sample and (c) the CT-MM3/quartz sample. Insets in (a,c) are the enlarged grey level graphs at high–order regions.

