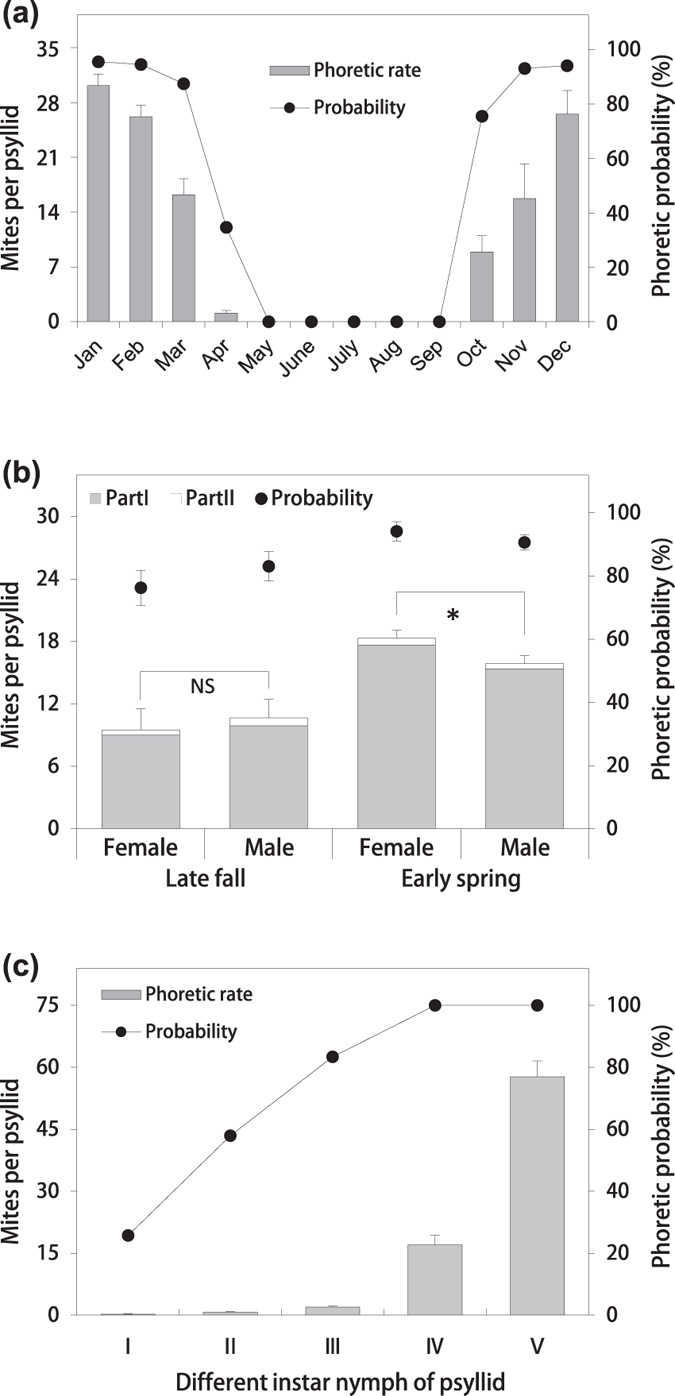
Figure 2.

(a) A monthly time series showing the phoretic probability (the primary y-axis; solid line and circles) and the phoretic rate (the secondary y-axis; grey columns) of A. pallida throughout the season. Error bars are + SE. (b) The phoretic rate and phoretic probability of A. pallida on females and male B. gobica adults in the late fall (59 females and 65 males; t = − 0.433, df = 122, P = 0.664, which is > 0.05) and in the early spring (480 females and 407 males; t = 2.26, df = 885, P = 0.024, which is < 0.05). For Part I and Part II, see figure 4a. Asterisks denote a significant difference between adult females and males of B. gobica (*P < 0.05), and “NS” denotes no significant difference. (c) The phoretic rate and phoretic probability of A. pallida on different psyllid nymph instars.
