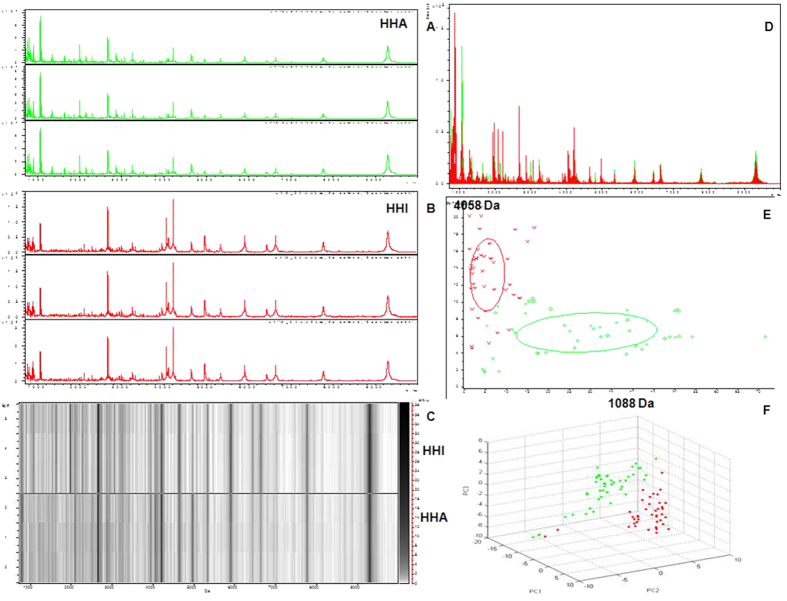
Figure 3. Reproducibility of mass spectra generated in individuals from HHI and HHA groups and comparative analysis of serum peptidome profiling between HHA and HHI samples collected at sea level.
(A) Representative mass spectra of a HHA (green) at sea level, in the mass range from 1 to 10 kDa showing low variability between replicates of the sample. (B) Representative mass spectra of one HHI (red) sample at sea level, in the mass range from 1 to 10 kDa showing low variability between replicates of this sample. (C) Gel view of mass spectra from a HHA sample and a HHI sample at sea level in the mass range from 1 to 10 kDa, showing low variability between replicates of each sample. (D) Overall sum of the spectra in the mass range from 1 to 10 kDa obtained from all HHI group (red) and HHA samples (green) at sea level. (E) Bivariate plot of HHI group (red) and HHA samples (green) in the component analysis with the most differentiated two peaks (m/z: 1088, 4058). (F) 3D plot of HHI group (red) and HHA samples (green) after subgroup separation in the component analysis.

