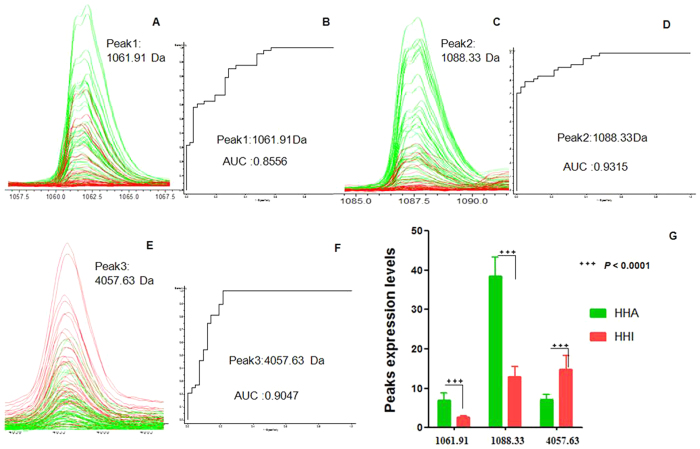
Figure 4. Representative spectra of three potential biomarker peaks in HHA group at sea level.
(A,C,E) Comparison of the spectra of three peaks in the HHI group (red) and HHA samples (green). (B,D,F) ROC curves for three selected peaks with their AUC values. (G) Average expression levels of three selected peaks in HHI group (red) and HHA samples (green) and their P values. Values are expressed as the mean ± SD.

