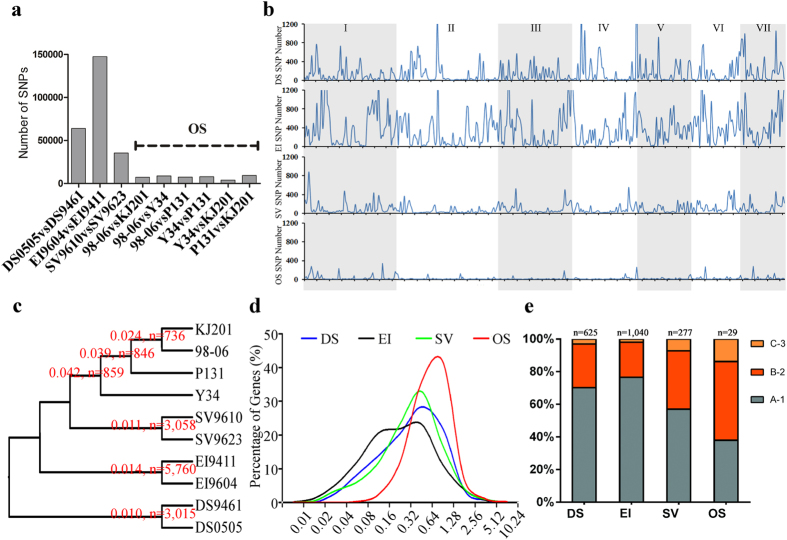
Figure 4. Whole genome comparison of natural selection between isolates belonging to the same host plants.
(a) Inter-groups genomic comparison of SNPs number. X-axis represents isolates that have been compared and Y-axis represents total number of SNPs between compared genome. (b) Whole genome distribution of SNPs in different chromosomes. X-axis represents different chromosomes of reference genome 70-15 and Y-axis represents number of SNPs per 100 Kb. (c) Inter-groups comparison of nucleotide diversity (π). The number of nucleotide diversity (π), number of gene sets with π > 0 are indicated along the node in the tree. (d) The percentage of genes experienced different level of natural selection (KaKs). X-axis represents values of KaKs and Y-axis represents percentage of genes with corresponding KaKs value. (e) Showed overlapping genes identified under selection in four groups, A-1 represents genes only understand selection in one group, B-2 represents genes under selection in two groups and C-3 represents genes under selection in three groups. DS, D. sanguinalis isolates, EI, E. indica isolates, SV, S. viridis isolates and OS, O. sativa isolates.

