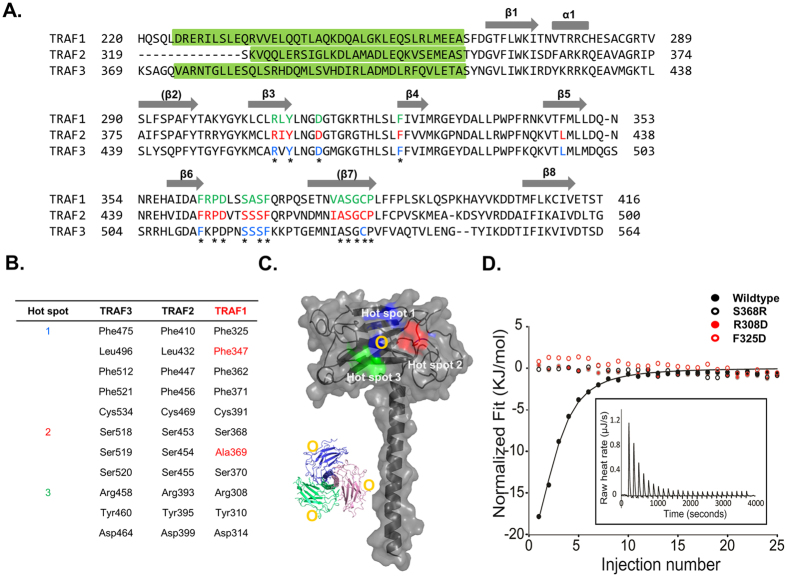
Figure 6. Mapping of proposed binding hot spots onto the TRAF1 TRAF domain.
(A) Structural based sequence alignment. The surface residues involved in the interaction with binding receptors on TRAF2 and TRAF3 are shown in red and blue, respectively. Conserved residues on the binding hot spots of other TRAF family members including TRAF2 and TRAF3 are shown in green. Completely conserved residues are indicated by stars. Green highlight box indicates TRAF-N coiled-coil domain. (B) Conserved residues on the binding hot spots of TRAF2 and TRAF3. Residues not conserved on TRAF1 are indicated by red. (C) Conserved exposed residues that might be involved in the receptor interaction are mapped onto the TRAF1 TRAF domain. The three expected binding hot spots on the TRAF1 TRAF domain are indicated by blue (Hot spot 1), red (Hot spot 2), and green (Hot spot 3). Yellow circles indicate the position on the trimeric structure shown on the left side panel. (D) Isothermal titration calorimetric analysis of the binding interaction of TANK peptide to TRAF1 wildtype and three mutants (Black closed circle: wildtype, Red closed circle: R308D mutant, Red open circle: F325D, Black open circle: S368D mutant), showing that only wildtype TRAF1 interacts to TANK peptide. Integrated isotherm of the titration and experimental fit to a single site model. A total of 25 injections were performed to measure the interactions.

