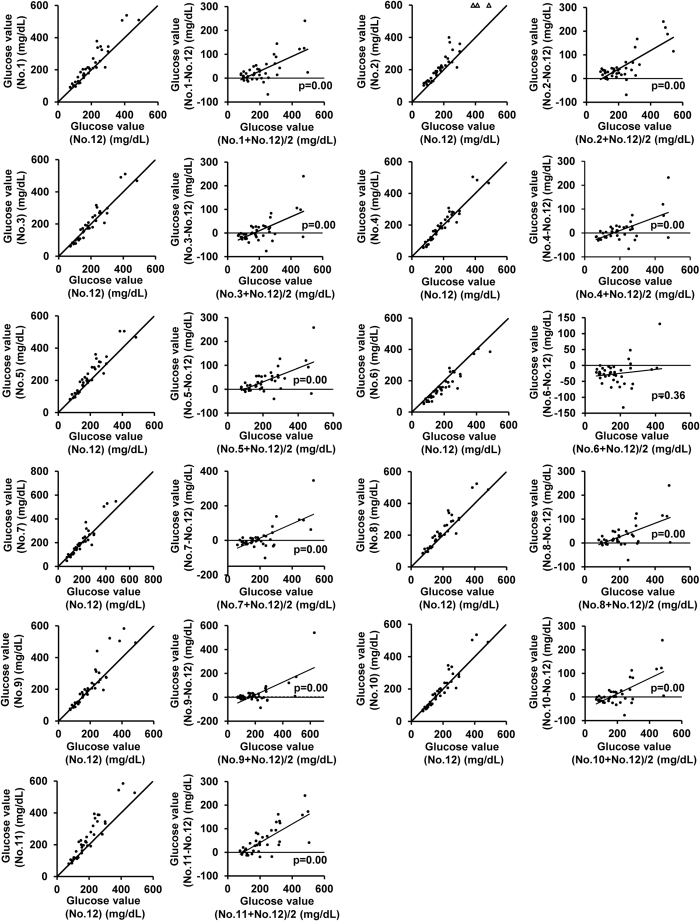
Figure 2.
Comparison of the glucose concentrations measured by the glucometers (No. 1–11) and the plasma glucose concentrations measured by a laboratory method in blood samples obtained by tail-tip amputation. Scatter plot (left) and Bland-Altman plot (right) of measurements by each glucometer (No. 1–11) and plasma glucose levels measured in the laboratory by the mutarotase GOD method (No. 12) in tail-tip blood samples (N = 40). Solid lines in the scatter plots (left) represent lines of equivalence. Solid line in the Bland-Altman plot (right) represents estimated conditional mean values for glucometer coefficients derived by linear regression. Solid circles indicate samples within the measurement limits of the glucometer. Open angles indicate samples showing values over the limit of detection of the glucometers. The p value for the slope is indicated in the Bland-Altman plot.

