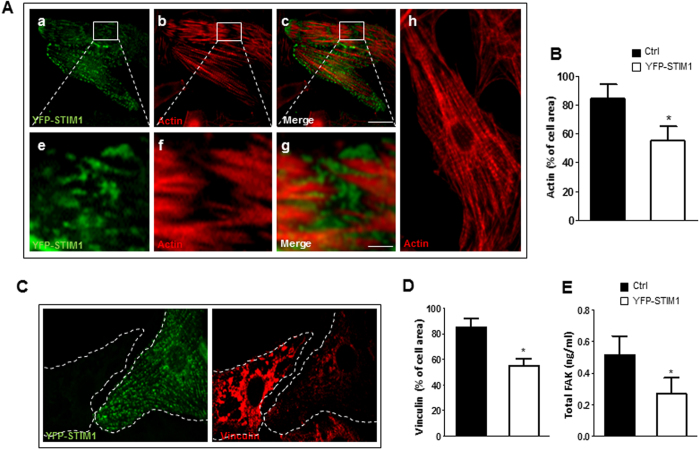
Figure 4. STIM1 overexpression in NVCM leads to myofibrillar remodeling and downregulation of focal adhesion kinase.
NVCM were infected with lentiviral YFP-STIM1. (A) NVCM were fixed, and identifiable by actin content labeled with rhodamine-phalloidin (a), co-stained with anti-GFP antibody to selectively visualize YFP-STIM1 (b). Bottom panels show representative fields displaying sites where STIM1 expression leads to loss of myofibrillar organization (e–g). This is in striking contrast with the regular actin pattern exhibited from non-infected control cells (h). (B) Bar graph showing average values of actin as percentage of total cell area in control cells or cells over-expressing STIM1 respectively (C) Representative images of NVCM stained with anti-GFP against YFP-STIM1 (green) and anti-vinculin (red). Dotted lines represent cell edges. (D) Histogram representing vinculin areas of control cells or cells expressing STIM1 respectively. Vinculin fluorescence intensity, values are normalized to the mean value of control cells. Values are represented as mean ± SEM (4 fields of view, three independent experiments). (E) Total FAK quantification from control and STIM1-YFP overexpressing cardiomyocytes. Intracellular FAK content was obtained with ELISA kit, bar graph representing signal emission at 510 nm. Experiments were assayed in triplicate. Data were plotted after correction for total protein quantification. Values represent mean ± SEM, n = 3 independent experiments *P < 0.05. Scale bar: 50 μm.

