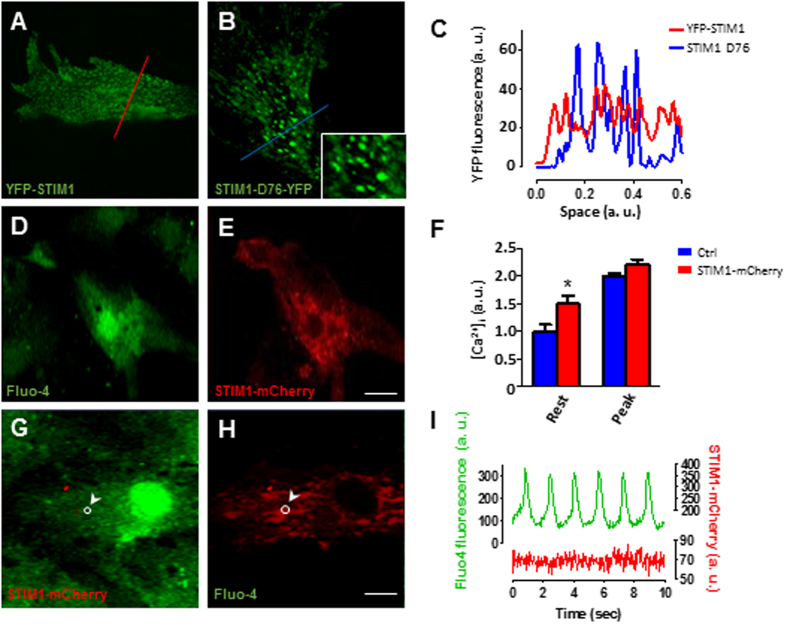
Figure 5. STIM1 overexpression forms puncta-like structures and alters intracellular Ca2+ dynamics in NVCM.
(A) Representative images from live-cell imaging of cultured NVCM infected with lentiviral YFP-STIM1. (B) NVCM expressing STIM1-D76-YFP, in the inset it is possible to appreciate STIM1-D76 clusters at higher magnification. (C) Intensity profile of YFP-STIM1 fluorescence along the red line from the image in panel (A) (red trace); STIM1-D76-YFP fluorescence intensity profile along the blue line from the image in panel (B) (blue trace). (D) Representative confocal image of a live NVCM loaded with fluo-4 and excited at 488 nm. (E) Same cells as in “panel d” excited at 587 nm reveling one cardiomyocyte expressing STIM1-mCherry. (F) Intracellular Ca2+ concentration levels between control and STIM1-mCherry transfected cells. Measurements were taken taken at baseline and at the peak of the [Ca2+]i transient then compared. (G,H), Cardiomyocyte loaded with fluo-4 and expressing STIM1-mCherry, a region of interest (ROI) is selected (white circle). (I) Simultaneous measurements changes of fluorescence intensity within the ROI (panel (g,h)) during [Ca2+]i transient (green trace, emission 515 nm) and STIM1-mCherry fluorescence changes (red, emission 610 nm). Scale bar (A–E) = 10 μm; G,H 20 μm.

