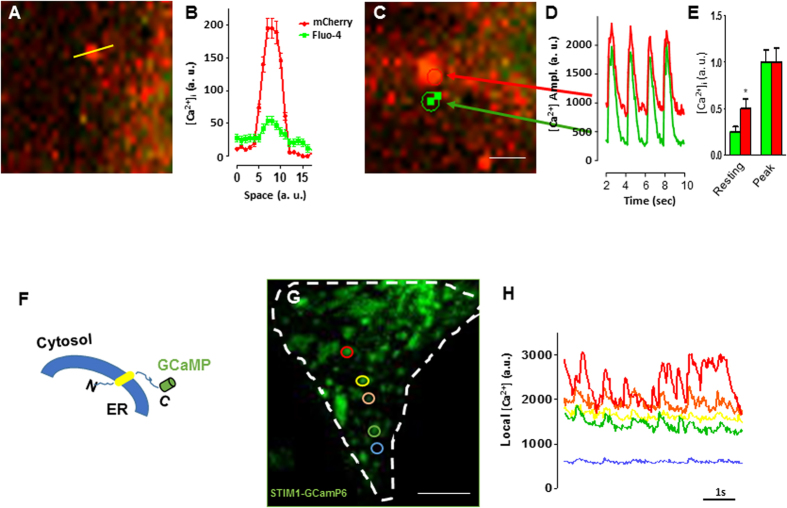
Figure 6. STIM1 clusters are associated with discrete Ca2+ microdomains.
(A) Representative image from a live NVCM transfected with STIM1-mCherry, cells were loaded with fluo-4 at the day of the experiment. Laser line-scan confocal imaging was used to quantitate both mCherry and fluo-4 signals, a representative laser line-scan confocal is drawn on a single STIM1 cluster (yellow line). (B) Intensity variations along the laser-scan line of STIM1-mCherry domain (red trace) and the distribution of [Ca2+]i (green trace) are plotted versus space. Traces show that [Ca2+]i level is higher in correspondence with the center of STIM1 cluster. (C) Selected region of interest of subcellular STIM1-mCherry microdomain (red circle) and a region that does not contain STIM1 (green circle), the cell is also loaded with fluo4. (D) Traces of fluorescence changes during electrically evoked Ca2+ transient plotted over time. Traces represent intensity changes in ROI (from panel (c)), arrows and colors indicate the corresponding spots where the measurements were taken. Images were acquired with simultaneous excitation wavelengths of 488 nm and 587 nm. (E) Bar graph showing [Ca2+]i transients peak analysis. [Ca2+]i values were taken at the minimum between each peak “resting”; and at the maximum [Ca2+]i concentration value at the peak of the transients “Peak”. (F) Cartoon representing the strategy followed to fuse GCaMP6 to the C-terminus of STIM1. (G) NVCM expressing STIM1-GCamp6, the white dashed line indicates cell edges, the color circle indicate selected STIM1-GCamp6 clusters. (H) STIM1-GCaMP6 fluorescent signals extracted from the correspondent subcellular clusters (panel (G)). The blue trace depict a spot where STIM1-GCamp6 is absent. Vertical scale values are given in arbitrary units (a.u.). Scale bar: panels (A,C) = 5 μm; panel g = 20 μm.

